We’ve updated the Watching That platform – across the board. We have new ways of connecting your data, visualizing your data, and troubleshooting your data. The overall effect is a more comprehensive overview of your Ad Revenue at Risk – and identifying what you can do about it.
You can jump straight to any of the individual updates below, or read through them all. And don’t forget to check in at the end where we’ll reveal what’s coming up.
Updates:
- Custom Metrics and Formulas
- Correlation Table Visualization
- Bid Level Database
- Support for CSV File feeds
- Trend Reports – Beta
- Improved Filtering
- New Graphing Engine
- Explore Module – Beta
- Monitoring via an IAB Compliant Pixel
- Single Sign On and other Enterprise Security features
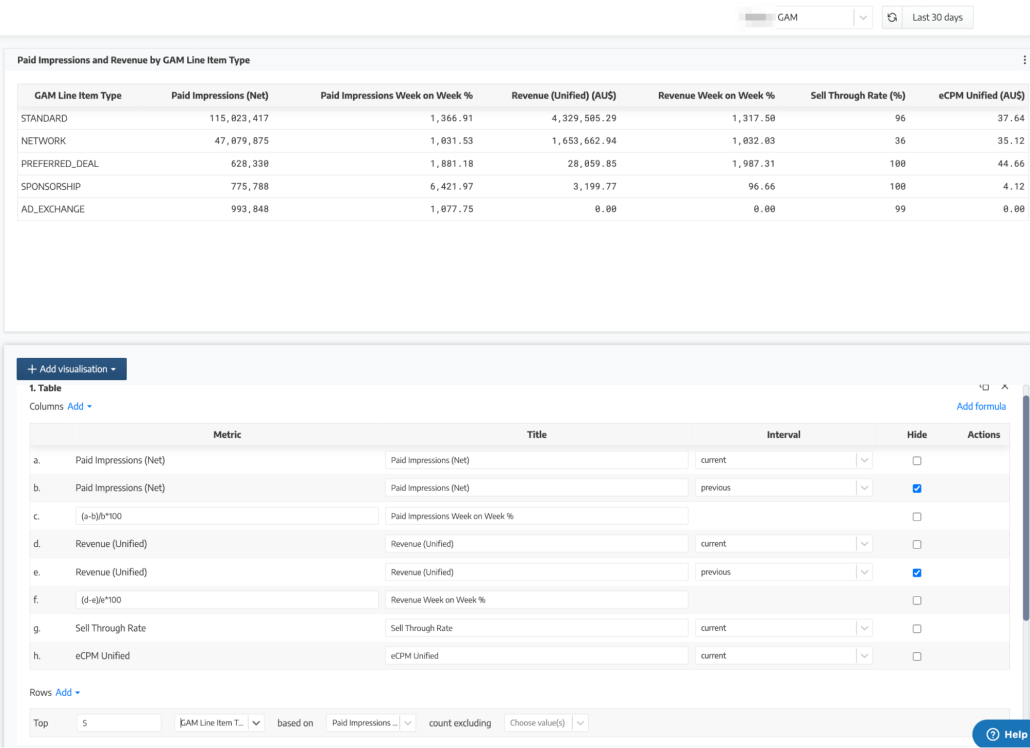
1. Custom Metrics and Formulas
Sophisticated businesses require sophisticated metrics. We’ve just levelled yours up.
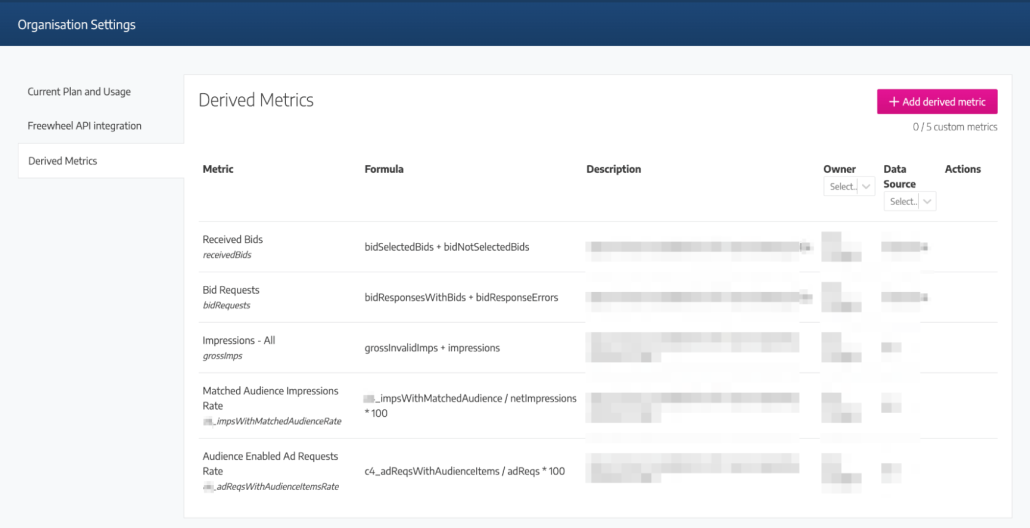
What is it?
Our intuitive interface leverages mathematical formulas and functions to achieve higher order metrics.
What is it for?
Tracking complex KPIs, or discovering new patterns, correlations, or relationships between your data points.
2. Correlation Table Visualization
Insights are the relationships between the data. Power up your Watching That Reports with the Correlation Table Visualization.
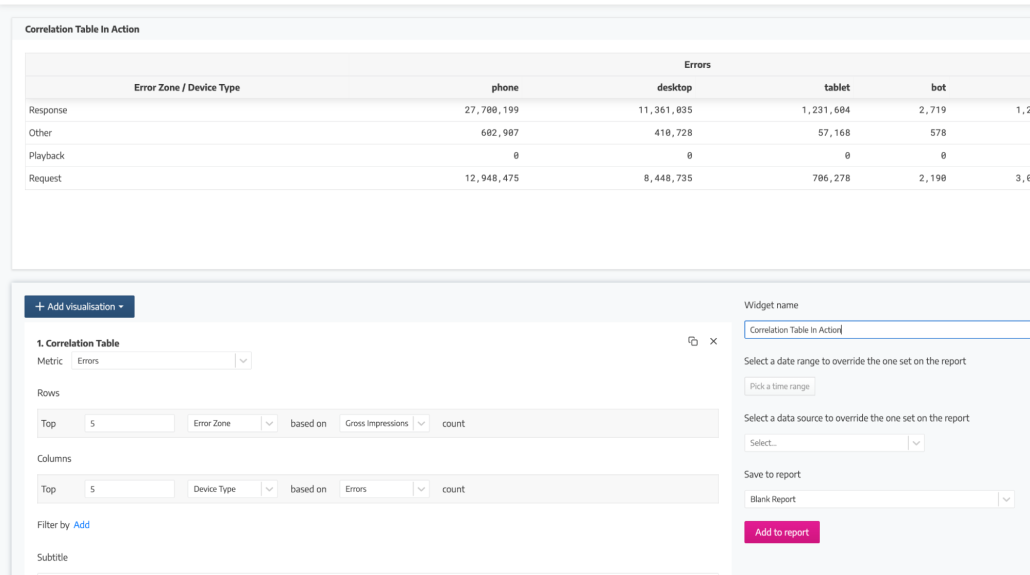
What is it?
A new visualization that lets you compare a metric between two dimensions in a way that emphasizes key information effortlessly.
What is it for?
Performing correlations will help you find new key insights in your data. For example, you could use it to track a metric day-by-day over your device group. Or see how errors cluster between your Campaigns and End Points.
3. Bid Level Database
There’s no doubt that programmatic revenue is a core part of your monetization strategy. So bringing in the data from programmatic activities is vital to understanding your Ad Revenue At Risk.
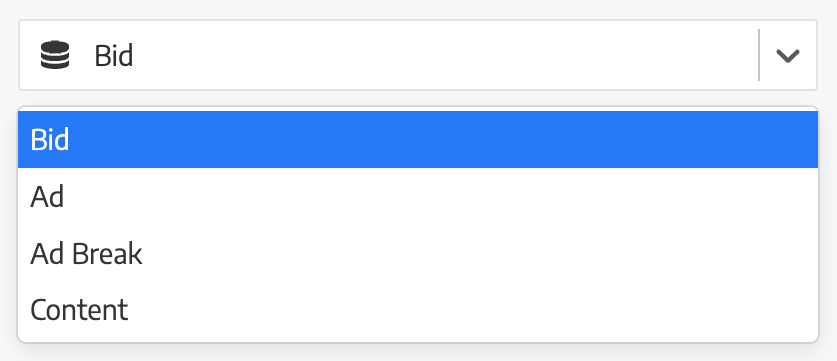
What is it?
We’ve added Bid Level data to our core set of Viewing, Ad Break and Ad Session databases.
What is it for?
With this new level, users can monitor and provide analytics into their programmatic bidding activity.
Currently supported by log level connections to Google Ad Manager (AdX) and Freewheel (coming soon), users can dive deep into the programmatic auctions that power a significant amount of their revenue.
Speak to your CSM to find out more.
4. Support for CSV File Feeds
Most likely your ad tech systems and servers only provide you reports in CSV (Comma Separated Values) files.
These tabular datasets are not overly useful until you load them up in a spreadsheet application like Microsoft Excel and then perform some functions and add visualization to them.
No doubt you’re left with a Frankenstien Report – terrifying and useless at the same time.
What is it?
You can now configure Watching That to consume these reports for you. The platform will collect and ingest them automatically as a data source for use across the platform.
What’s it for?
Want to have all your SSP revenue data and ad server data in one highly visual report? This is the answer.
Speak to your CSM to find out more.
5. Trend Reports [Beta]
One of the bigger launches of the year, our Trend Reports have proven to be a massive hit.
Every day, operations teams tirelessly collect and compile key delivery data to ensure campaigns are delivering and ad tech is working.
As the level of complexity in campaigns, distribution and operations continues to increase, this is proving to be a massive challenge. It’s simply not scalable.
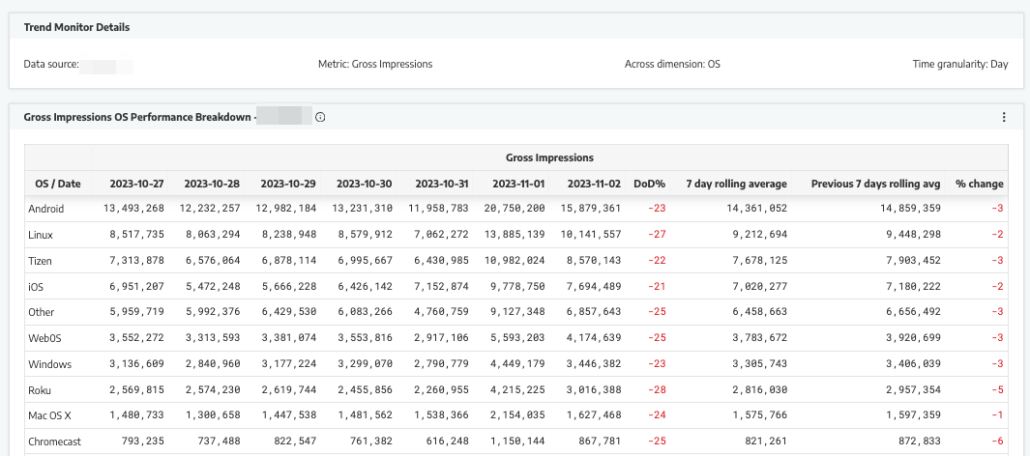
What is it?
Watching That Trend Reports automate the delivery of highly tailored business data to key stakeholders right into their inbox.
What is it for?
The report sends day on day and week on week tracking data across key dimensions. It then also overlays conditional formatting to highlight that all-important critical information.
With Trend Reports you’re presented with the needles in your adtech haystack right in your inbox.
Speak to your CSM to find out more.
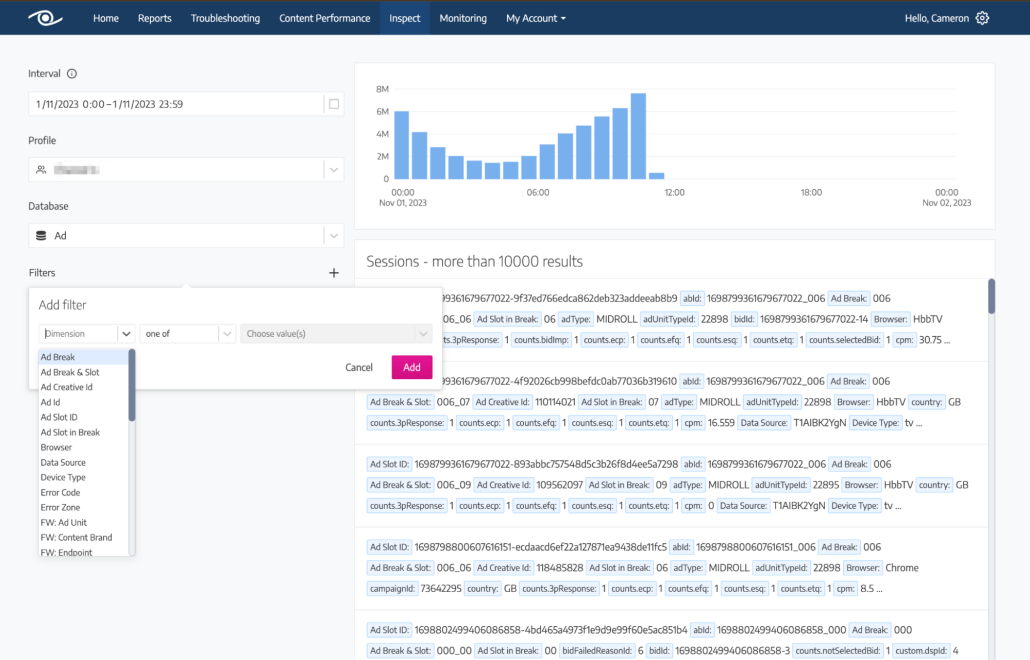
6. Improved Filtering
Previously, when filtering in the Watching That platform, you could lock-in the specific values you wanted. Now you can go beyond that with the ability to look for the existence of the value.
![]()
What is it?
Watching That has launched an upgraded Filtering system that now includes new options that allow you to check for the existence of data, along with evaluating what the value is.
What is it for?
This is extremely useful in the case of targeting and ensuring key value pairs are properly inserted into all your ad requests/tags.
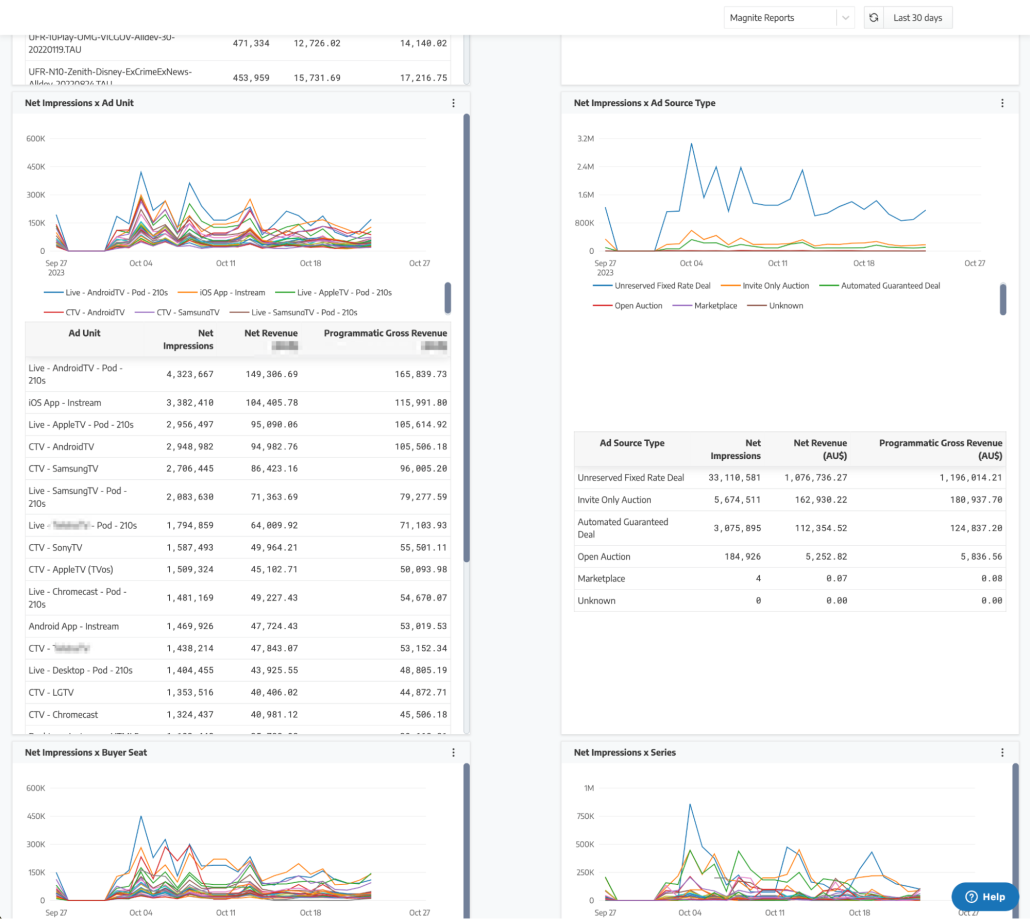
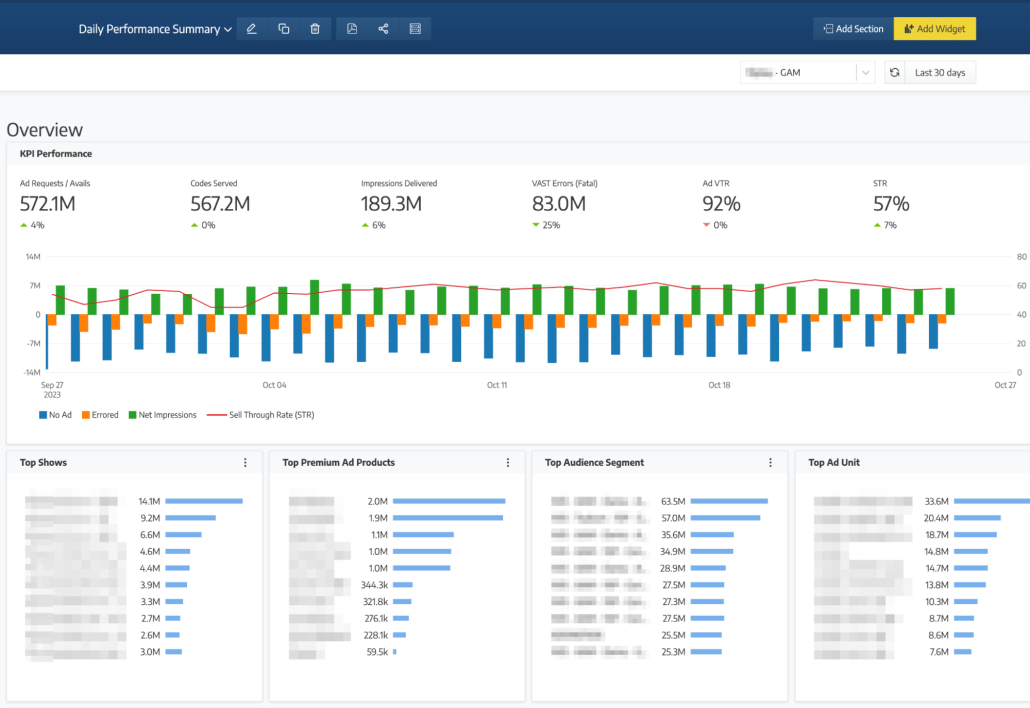
7. New Report Visualisation Graphing Engine
Clear visualization can mean all the difference when it comes to analysis. So, to increase the fidelity of our visualizations we’ve upgraded our core graphing engine.
What is it?
Better, more powerful visualisations
What is it for?
You’ll notice smoother load times, with friendly animations.
There’s clearer charts and data lines too. It all makes interpreting the data more enjoyable.
8. Explore Module – [Beta]
Getting deep into data can wield profound new insights that can be game changing. But it shouldn’t need a degree in data engineering, and learning to code SQL!
We’ve started solving this problem with the Beta release of our ‘Explore’ module.
What is it?
This module allows you to create high dimensional data sets that pull straight from the database.
What is it for?
The friendly and easy-to-use UI allows data novices to translate their questions into data queries.
The results can then be downloaded or further manipulated as you wish.
We have big plans for Explore, speak to your CSM to keep up-to-date.
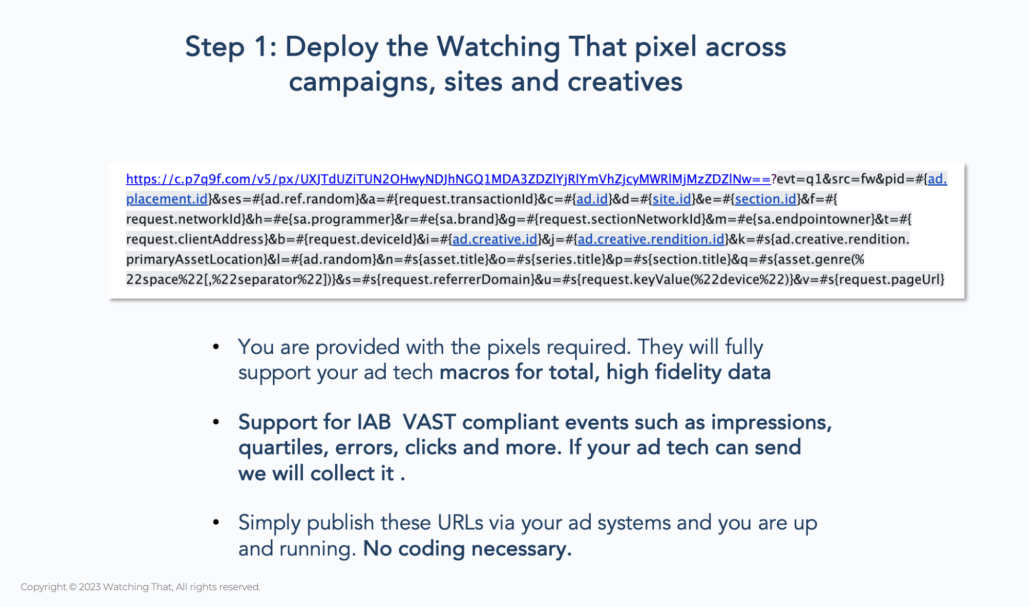
9. Our No Code Monitoring Pixel
In an ever-fragmenting viewing landscape it’s becoming more and more urgent to ensure you have a total inventory monitoring solution. It’s also increasingly challenging to deploy the necessary code to do this. Introducing our Pixel Monitoring solution.
What is it?
Watching That now offers an IAB Compliant VAST Pixel that can be deployed, without code, into your ad serving technology.
Achieve total, real time inventory coverage without any new app updates, asking partners to drop in tags, or bother your overstretched data and IT teams.
You’ll be given a pixel for each event you’d like to track (impressions, quartiles, errors, etc.) and then just deploy via your ad server.
Job done.
What is it for?
You’ll enjoy a real-time event stream that can power all aspects of your Watching That account.
This is especially useful in FAST and other distribution networks where you have no control over the platform’s code but still need clear and actionable analytics.
Get in touch with your CSM to find out more.
10. Single Sign On and other Enterprise Security features
We’re committed to providing our customers with the level of security they require and demand.

What is it?
We’ve introduced the ability for Watching That to link up with your chosen SSO provider, and turn on multi-factor authentication and usage logging.
All of this and more is available with our Enterprise Security pack.
What is it for?
This means we’re more compatible with ever-increasingly tight security demands of enterprise businesses. You can use Watching That safely knowing the data flowing through is secure.
Get in touch with your CSM to find out more.
Coming Next: Inspect Module launch
In the near future we will be launching our newest module : Inspect.
This module will allow users to access the specific sessions we hold in each database.
Using drill-down features, users will be able to hone in on a single viewing session, ad break or ad slot.
All the data points we store for those sessions will be available.
Aimed at our expert user group, this goes well beyond just getting a few event roles from a CSV log file. Now you’ll get the full record of each and every session we store for you.
More info on this is coming soon. Get in touch to be the first to know.