In the digital world from – eCommerce to video advertising – the metric Sell Through Rate is a key performance indicator.
Because of its importance to CTV publishers and its ambiguous definition we thought it’s worth unpacking it in our latest edition of our Let’s Talk About… series.
So we’re going to break down Sell Through Rate:
- What is Sell Through Rate?
- Is Sell Through Rate actually a useful metric?
- How to make it actually useful
- Why are so many measuring it wrong?
- So how do I get the right formula ?
-
What is Sell Through Rate?
A close cousin to Fill Rate, a fundamental metric in display advertising, Sell Through Rate (or Sell Thru Rate in the US) measures how well, or not!, a publisher is filling available inventory with ads.
The primary difference to Fill Rate, however, is that Sell Through Rate takes into account the fact that streaming video (and audio) inventory is time based, not just impression based.
Here’s an example
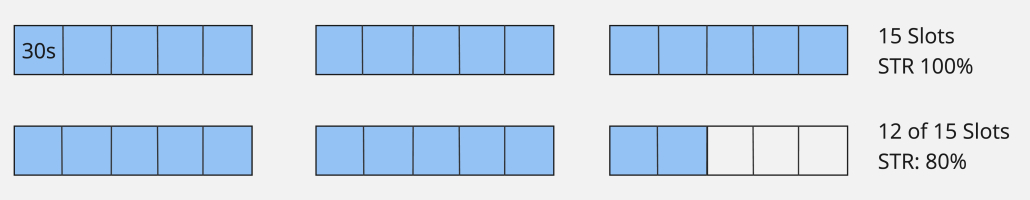
A viewer streams a TV show on your app and they see 3 ad breaks. Based on your ad break policy each of those ad breaks can have 5 ads which are each 30 seconds in duration.
The maths disctates that you can deliver a total of 15 x 30sec ads (3 x 5), which would result in a 100% Sell Through Rate.
But, given its duration characteristic, the maths also says you can deliver 1 x 90sec ad and 4 x 15sec ads, because this equals 5 x 30sec ads. This would also result in a 100% Sell Through Rate, or STR.
However, let’s say you’ve received a report that says you delivered 12 x 30sec ads. Then your Sell Through Rate is 80% (12 out of 15 ads were delivered).
For an ad funded streaming business this is a simple calculation that measures and tracks your money making performance.
It also ensures you’re measuring real available inventory. What I mean by this is it deals with the quirk in streaming media advertising that doesn’t exist in display advertising.
The fact that many ad requests from your content don’t transact at all.
In display advertising you load a page and fill all the ad units. Whether a user scrolls that page or not is irrelevant to whether the ad is rendered, and therefore an impression is generated, and the Fill Rate metric works.
But in streaming the ad can’t be rendered until the viewer gets to that part of the video stream. And there is no guarantee that the viewer ever will. (As an aside this is the reason why viewability really isn’t a thing in CTV and why ‘Attention’ is becoming the value measurement of choice.)
Because of the scale of video streaming right now, video streaming technology providers rely heavily on caching strategies. In the case of video streaming they use a standard called VMAP.
I won’t get into its details in this post but you can dive deep here if you want. What you need to know is that VMAP works like your Spotify playlist: You make one play request and a full list of songs is returned that you work through as you like.
The VMAP protocol allows for the same to happen with video streaming advertising. One ad request returns the ‘playlist’ of ads for all possible ad slots in a video stream, irrespective of the viewer watching up to that point of the stream.
So, in our example above, that video stream could be 2hrs long and having 10 ad breaks. Instead of 15 ads there are actually 50 ads that can be theoretically displayed.
If we measured using the 50 ads then our STR plummets from 80% to 19%.

But given the user only watched 3 breaks, the remaining 7 go unrendered and not sellable so are excluded from the STR calculation.
So no wonder it’s a metric that is often used as the key North Star tracking metric for streaming businesses.
Leveraging it to improve your performance, however, is something different altogether.
2. Is Sell Through Rate actually a useful metric?
Every top tier streaming publishing customer we work with uses Sell Through Rate (STR) as a strategic KPI. That’s to say pretty much every executive we work with wants to know and track their STR.
On the surface you can see why. If I’m steering the ship and I know I can be doing 20% more ads than I’m doing now (per the example above), that gives me a direction and reasonable target to align my resources towards.
It’s also typically a comforting metric because it’s so vague and rarely comes in at a low number. So as far as reporting goes it’s a ‘good news’ metric that is easy enough to understand so it can service a wide audience.
But the minute you want to improve / optimise your STR, well that’s when its vanity is felt – because more often than not it lacks context to make it useful.
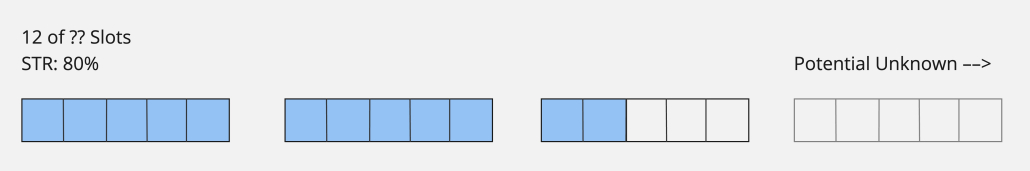
Let’s go back to the example above where we have a viewer watching a 2 hour long movie that gives us the opportunity to deliver 50 ads but in actual fact we only deliver 12 out of the 15 we’ve rendered because the viewer dropped off.
Our STR report would look like a really healthy 80% but it would be lacking true insights into how much more could we be doing?
As a leader do I want to know how well we are performing with what we generate? Absolutely!
But I also want to know how much more we could be generating. And STR does not give me that. I have no idea that there are a whopping 35 more ads out there to be had!
Using STR in another way, how can we figure out why we have 20% unfilled? Well… we can’t.
At least not in isolation.
Remember traditional STR formulas use default ad duration as the base measure, and then just tell you how well you’re getting ad packages that overlay your default ad break pattern.
Yes, in many cases, the maths does work out that multiples of your default ad duration (15s, 30s, 60s, 90s etc.) to help smooth this out. But how does focusing on how well I match up my ad durations to my break patterns really help drive my business forward?
Don’t get me wrong, there are good applications for STR in this form. Probably most notable is ad insertion in live streaming of broadcast channels. These streams have inbuilt ad breaks (that are put into the linear broadcast) that you need to overlay with digital video ads. Here you want to get a glove-fit so the user isn’t left with no content stream (AKA a holding slate) or with weird ad break ins.
But that’s a specialised use case.
3. How to make it actually useful
Something more is needed to make it useful, and that is adding CPM (the cost of your inventory per thousand).
STR that is based on ad duration requires every ad CPM to be unified because it’s forcing me to measure my business on how well I match ad durations, not highest CPM.
And that is simply not the case as the industry increasingly adopts programmatic trading practices.
Let’s go back again to our example.
Scenario 1 12 out of 15 ads is a good 80% STR
Scenario 2 6 out of 15 ads is a poor 40% STR
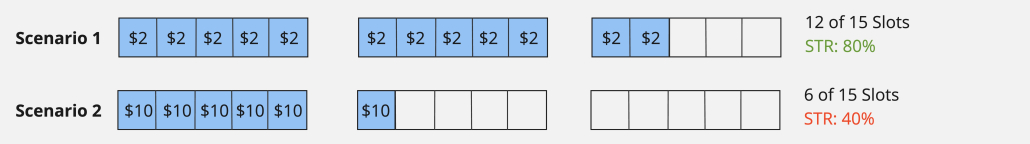
But that only works if all ads make me the same amount of money.
What if, in the first scenario, those 12 ads were low paying $2 CPM ads and in the second scenario those 6 ads paid $10 CPM?
In scenario 1 I make $24 and in scenario 2 I make $60.
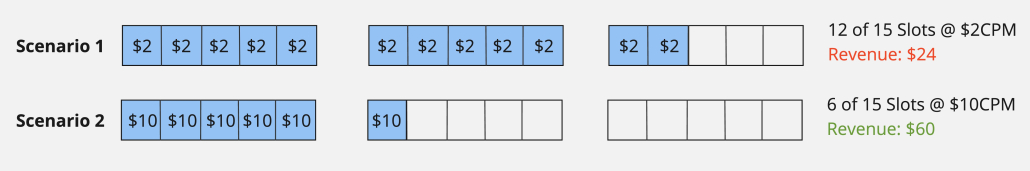
Which would you rather have?
And yes I know the idea is to get every ad at $10 CPM (or higher) but you are only saying that AFTER you did the review based on CPM and not STR. If you just had the 80% vs 40% you’d be backing scenario 1 all day long.
So with the great power of STR comes great responsibility to make sure you’re not blinkering yourself with a ‘good news’ metric.
4. So why have you been calculating Sell Through Rate wrong for so long?
Because the ad servers told you so.
Unfortunately in the case of STR, this is one of those metrics publishers have simply had to accept as something meaningful from the vendors that provide them.
Rarely do we see customers prepare their own STR calculation because as simple as the formula is it’s a near impossible lift to manually get all the data required for it.
Many years ago I was pitching our software to a GAM powered publisher. In that meeting we were presenting a much lower fill rate measure than they were getting from the ad server.
The reason for this was our fill rate included everything coming from the client app and the ad server was only counting what it received. So ad requests that didn’t make it off app due to ad blockers etc. were excluded from their fill rate calculation.
Despite our metric being much more logical and, crucially, actionable the ad ops lead said “our single source of truth is Google and if we accept yours we’d need to shift our whole source of truth… and that is a much lower/poorer number. I’m fine with that but you’ll need to explain it to my boss”. Needless to say they didn’t go for it.
Changing religions involves massive revolutions and no one wants to be the martyr.
STR is such a metric. It’s been part of the doctrine for so long that shifting it will require a revolution of biblical proportions but it needs to happen for the future of TV is streaming and STR, in its current duration based formula, belongs in the dying linear TV age. RIP.
5. Ok, so how do I get the right STR formula?
To be actionable and useful your STR calculation needs to take into account the yield of your ad fill and not the duration of your fill.
This means moving from a duration-based calculation to an impression-based formula. This might sound like a regression to the Fill Rate of Display Advertising, and it is of sorts but with two major improvements:
- Replace Ad Requests with Rendered Ads (only includes ad opportunities that actually render in front of the viewer); and
- Use Paid Impressions vs Net Impressions (excludes any house or bumper ads that don’t make money).
It looks something like this:
Sell Through Rate = Paid Impressions / Rendered Ads * 100
If you adopt it I can guarantee you that your STR will drop a good few percentage points – so please, no messages complaining. But that’s no bad thing, because it’s actually telling you something useful and actionable.
It’s also easily counteracted by pairing STR with CPM tracking.
Got 40% with this new STR when you’re used to 80%? Yep that’s going to be uncomfortable for a bit, especially when you tell the management team, until you start analysing this metric.
Because now you’re not trying to figure out why you’re not getting enough 15s ads to squeeze into the tail end of your break. Instead you’re looking at how well your paid demand lines are performing, who’s doing more for you CPM-wise and where.,How you can drive up your yield and understanding where ad delivery is failing.
And from here you’re taking action and actually improving things. Because again, I ask, how often have you ever heard of someone driving up their Sell Through Rates using the duration-based formula?
Or *shudder* how many times have you heard being completely sold out!
Using the duration-based STR all that is saying is you have matched your ad durations perfectly to your ad break durations… congrats? Did anyone even notice that over 60% of those ads were house and bumpers?
This new approach means you’ll go into each steering meeting and show real improvement that has a direct tie to revenue growth.
Now that’s something to cheer about.