Walk into the CRO meeting knowing the numbers add up.
Watching That pulls every ad-revenue report — every SSP, DSP, ad server and partner, even the ones that only arrive as an email attachment — into one reconciled number you can trust, automatically. No more stitching spreadsheets that never tie out.
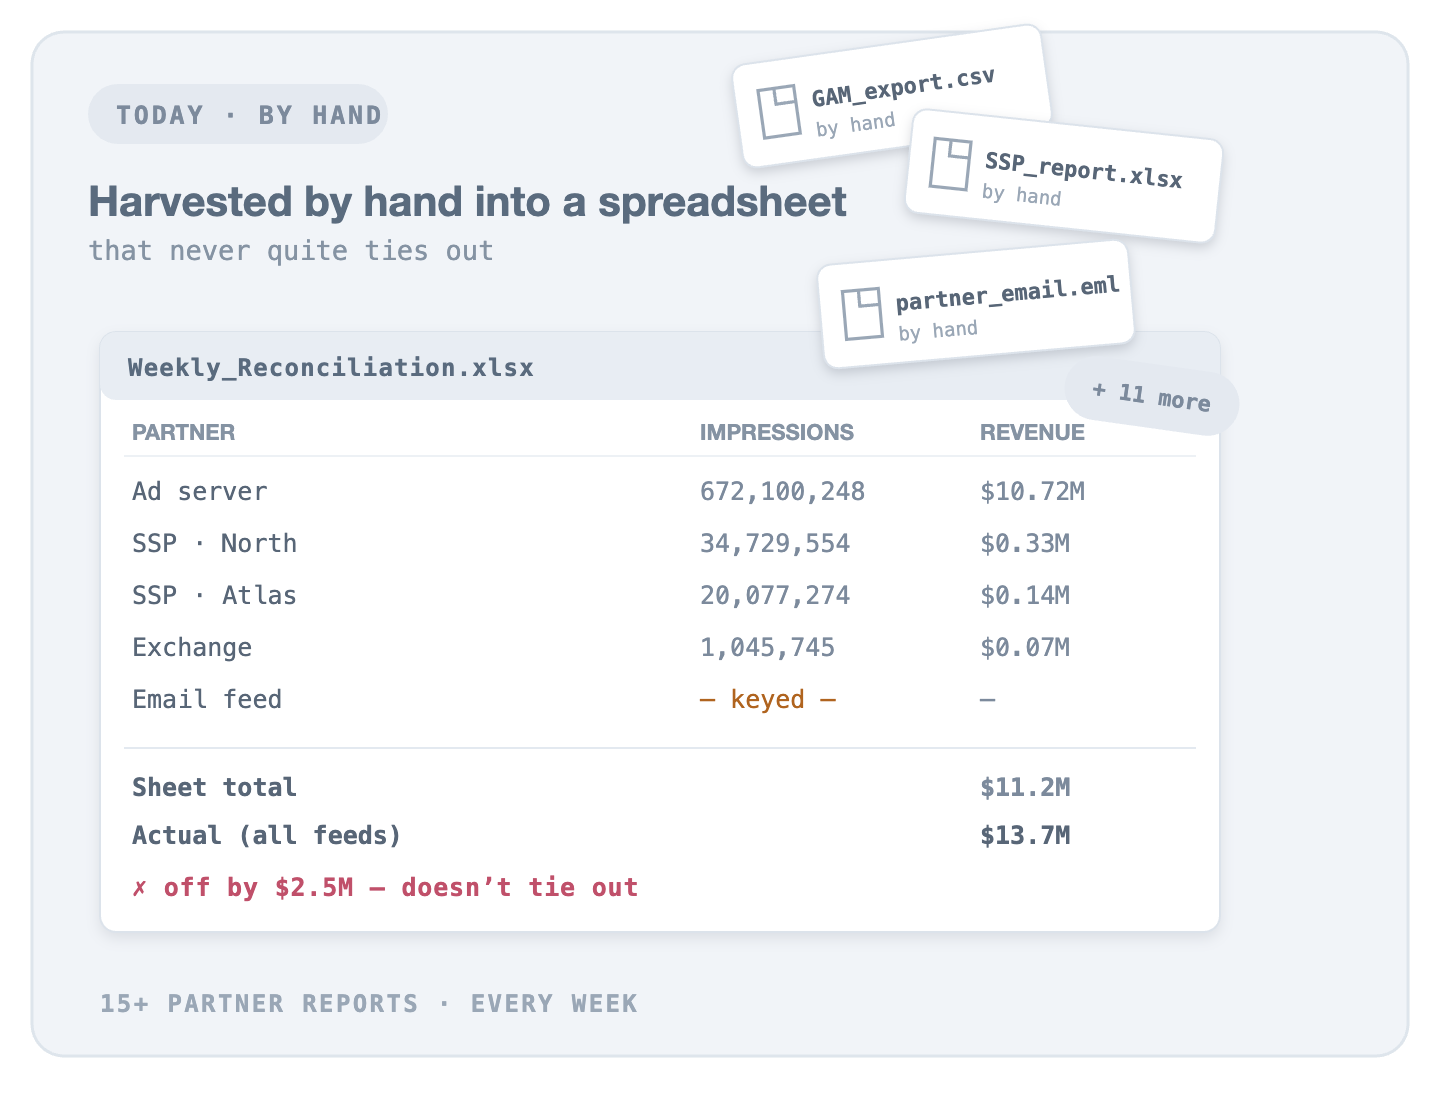
Every SSP, DSP, ad server and distribution partner reports in its own portal, its own format. Your team harvests it by hand into a spreadsheet every week — and it still never quite ties out. So when the CRO asks “what did we make, and why did it move,” you’re scrambling.
Before
15+ partner reports stitched by hand, never tying out.
Enlarge ⤢
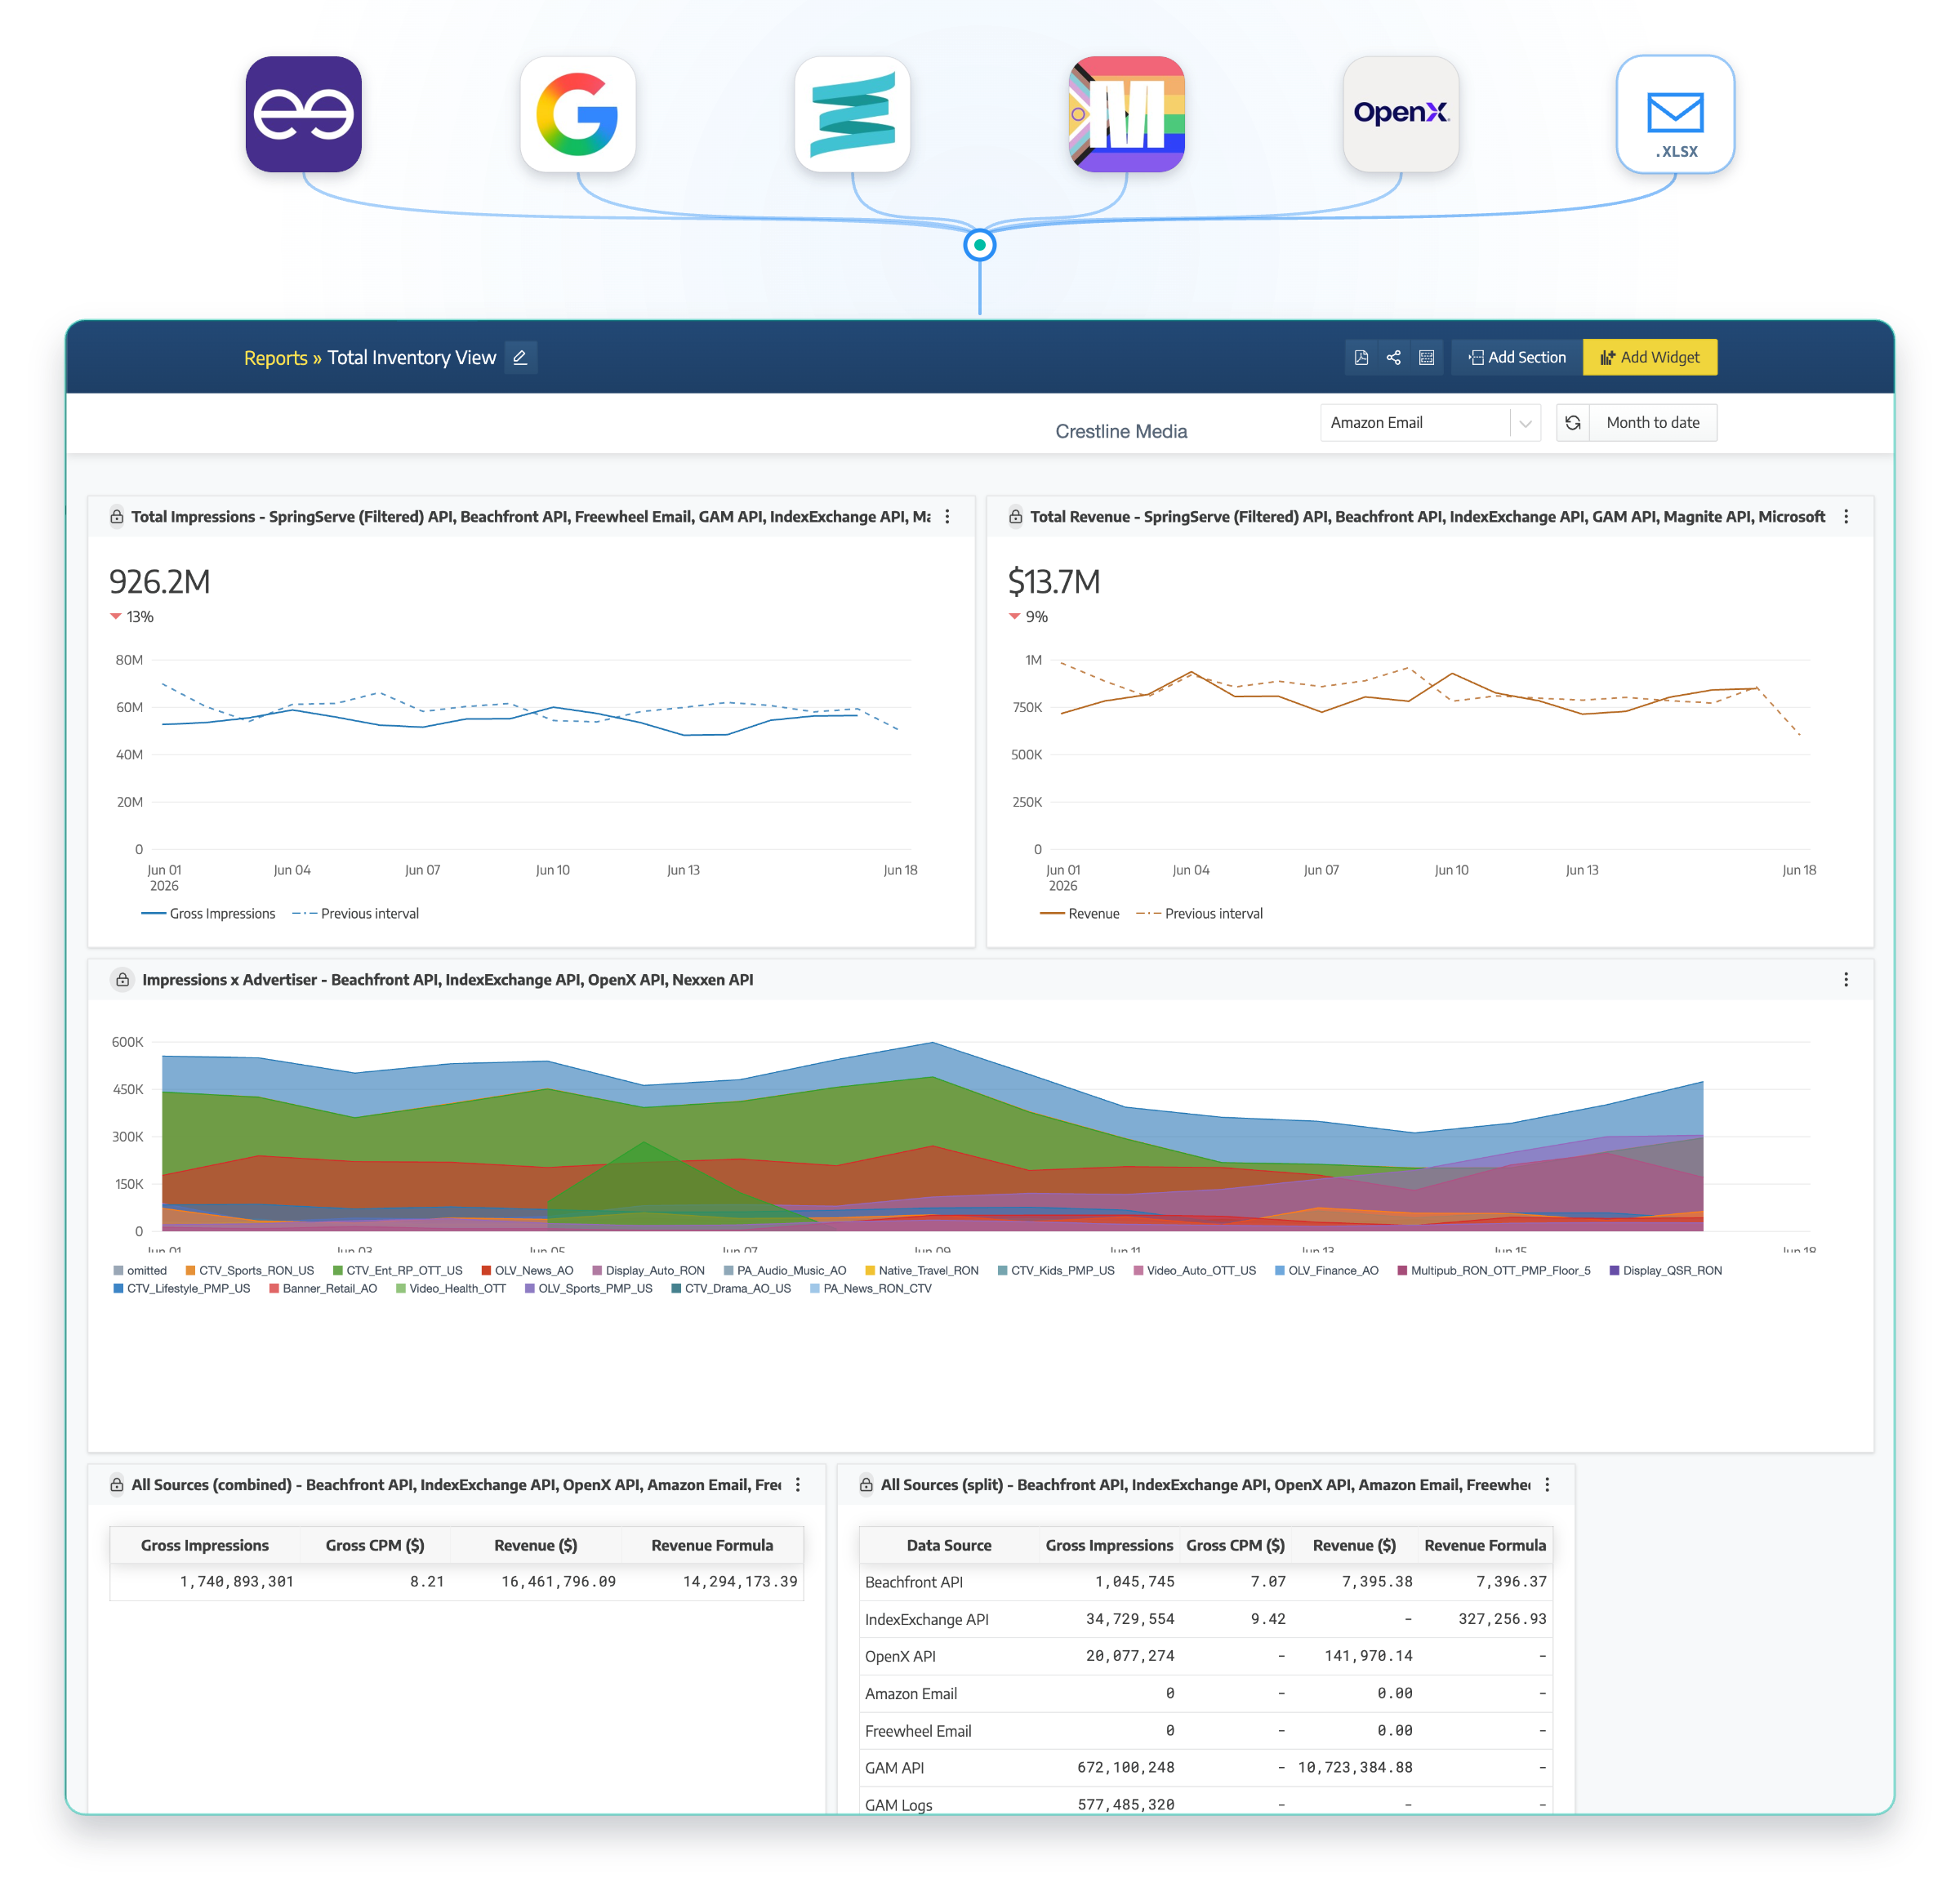
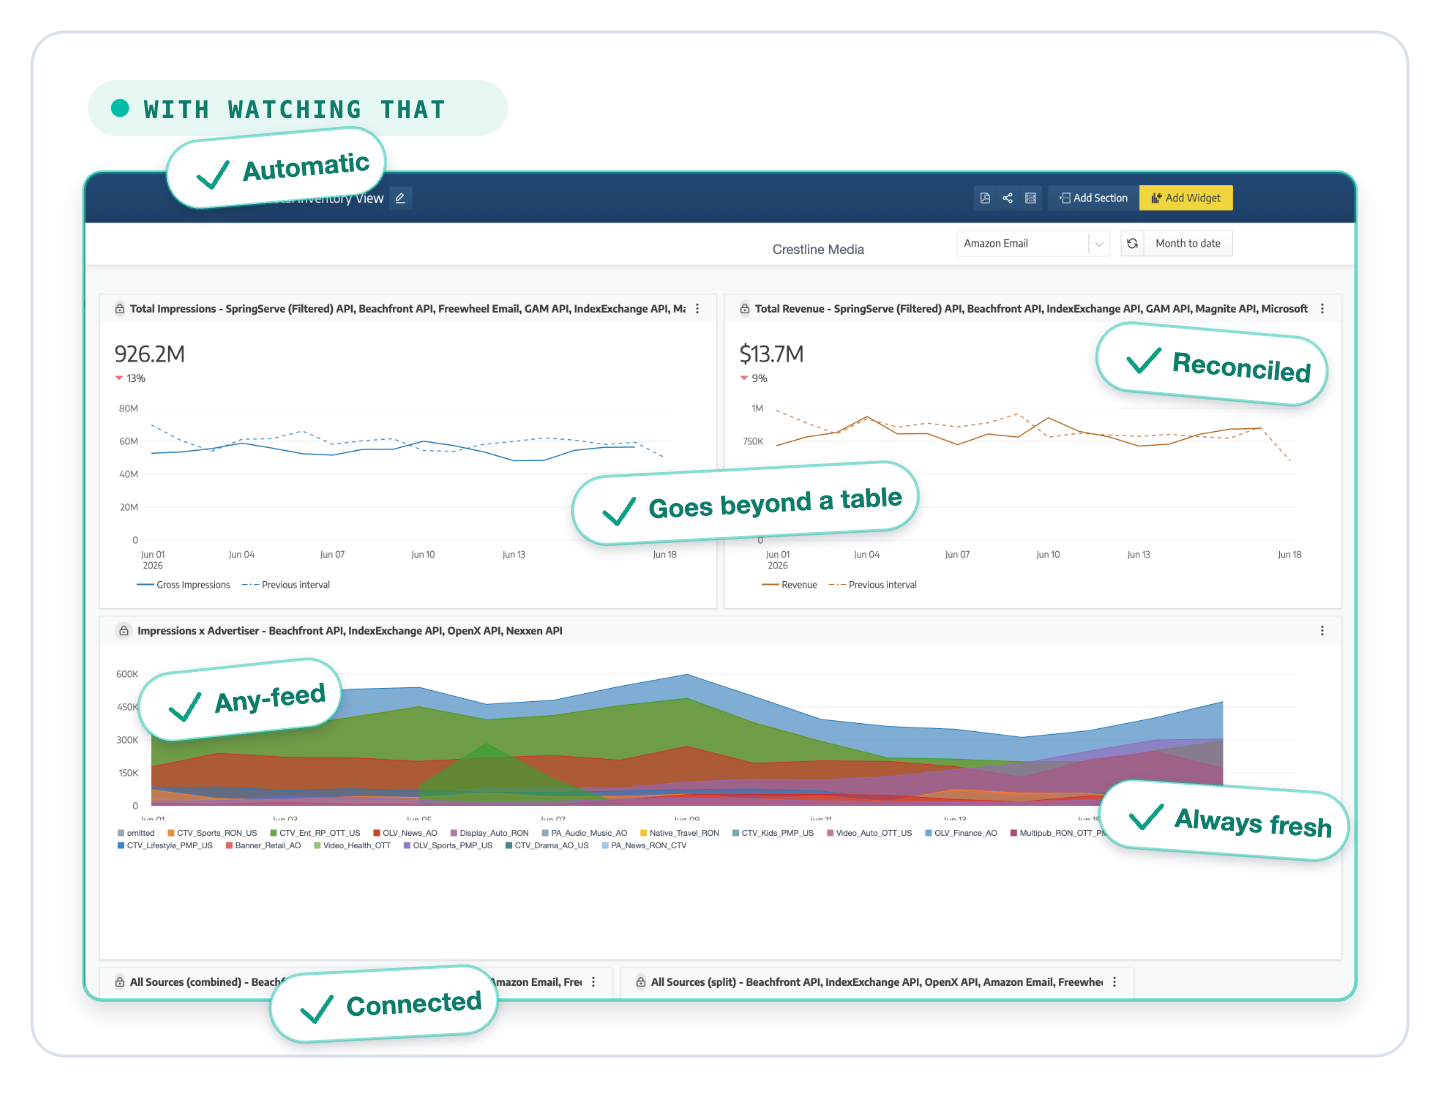
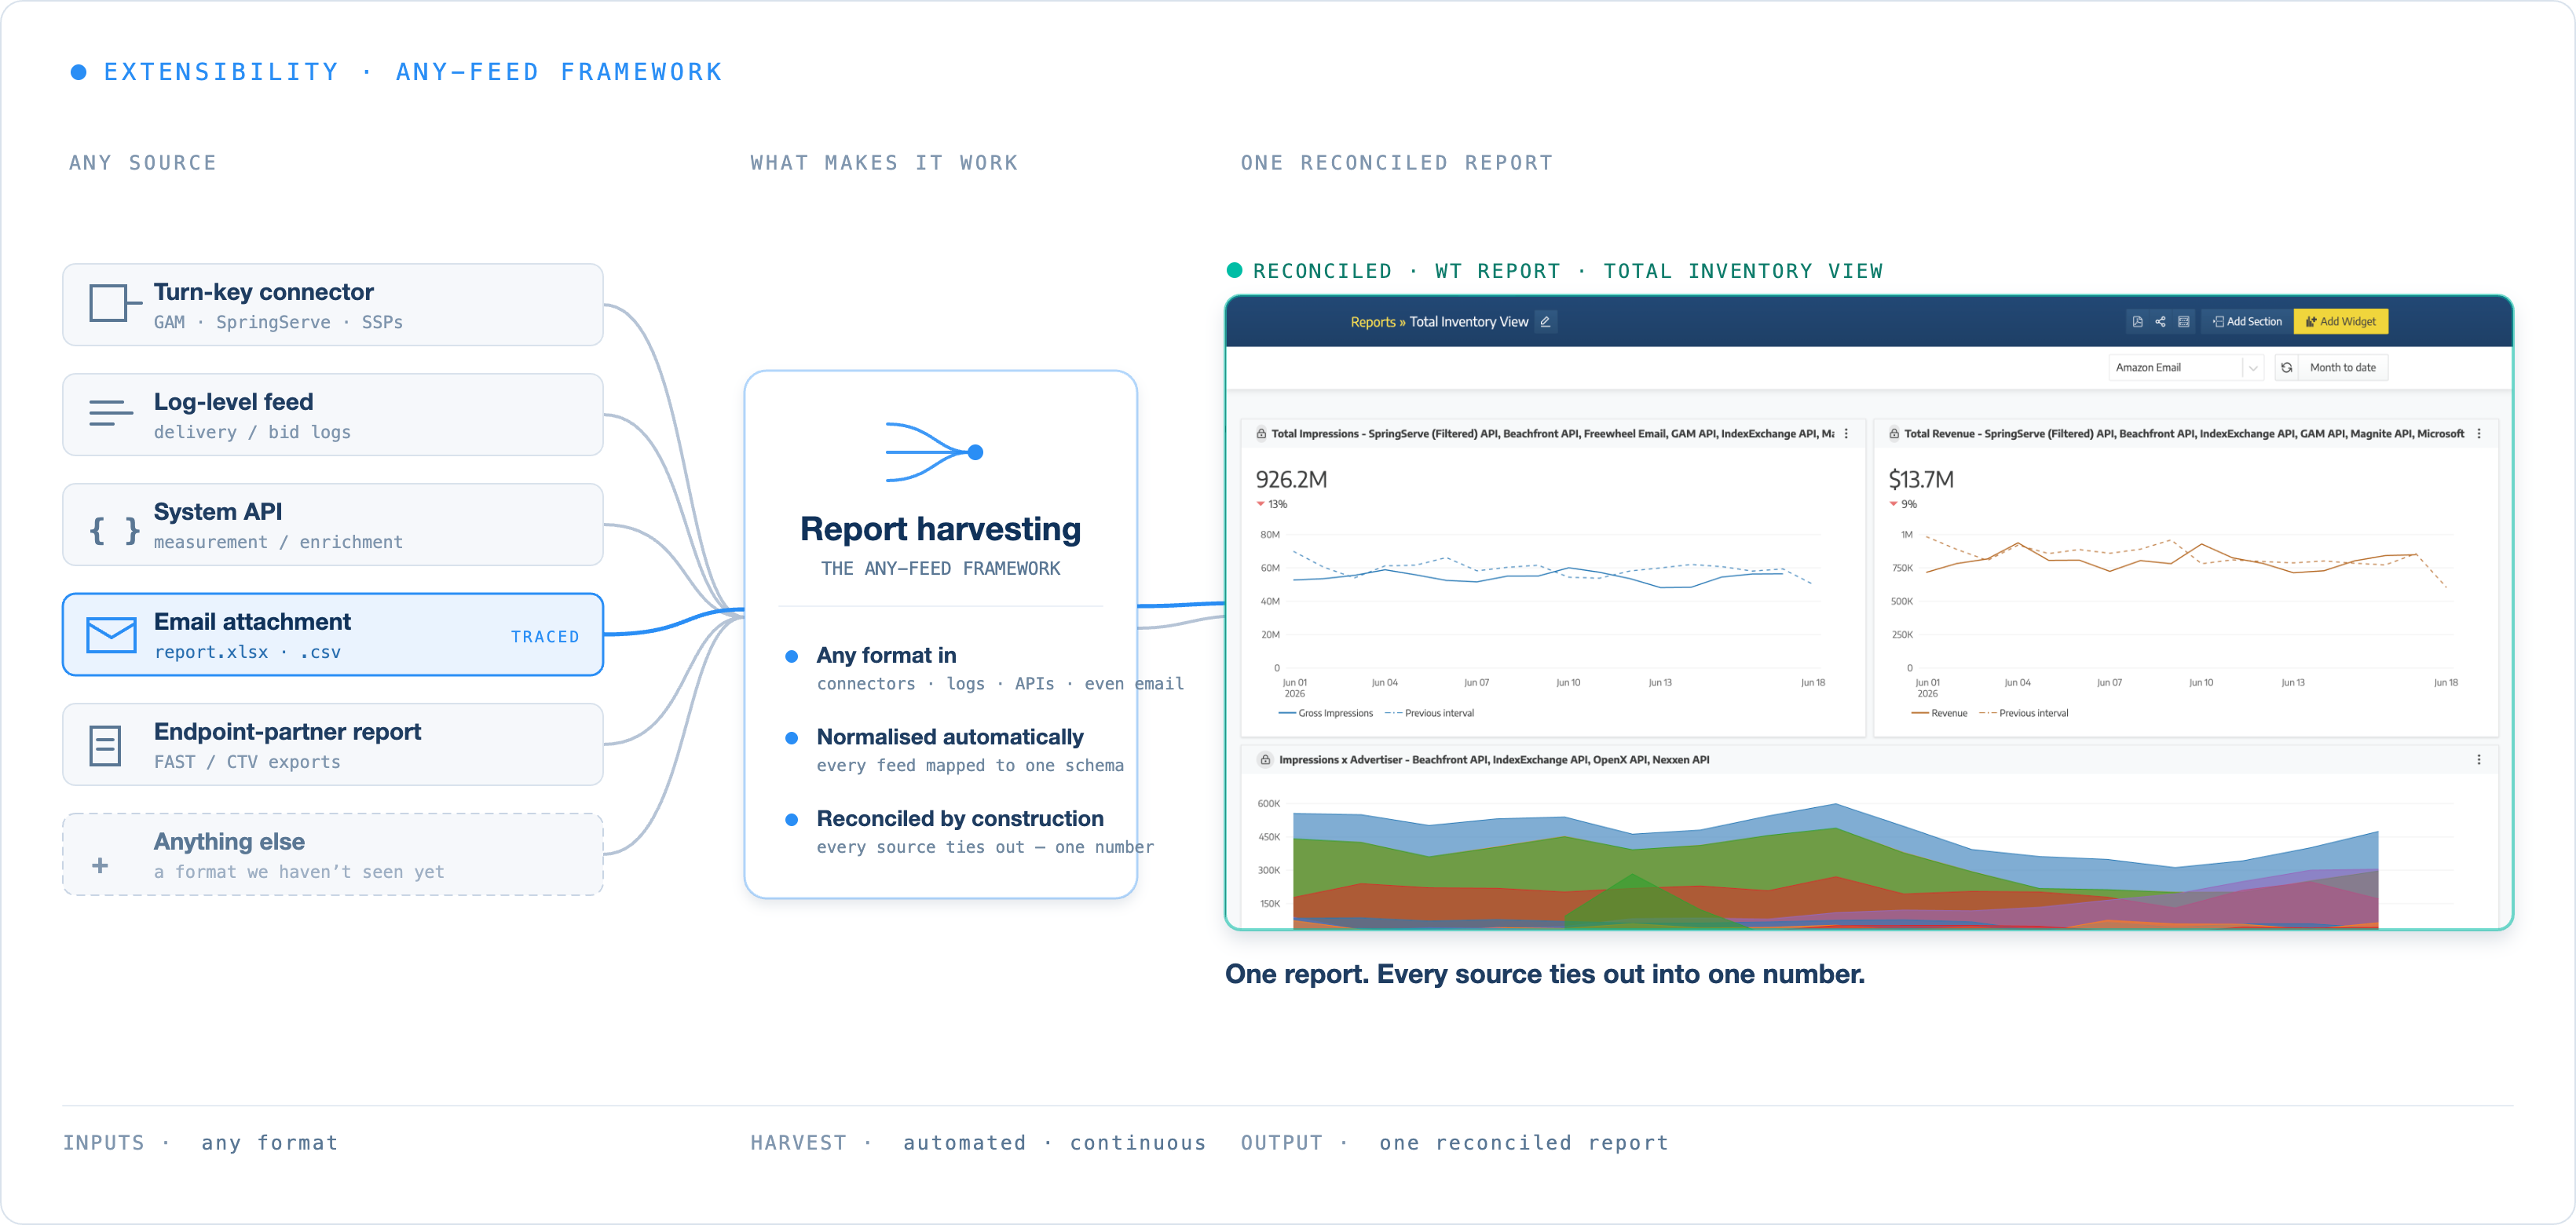
After
One reconciled number, automatically.
Enlarge ⤢
01 · Every source, its own portal
Eight portals. Eight formats. One deck due Tuesday.
FreeWheel tells one story. Magnite tells another. Each distribution partner tells a third — multiplied across every brand you run. The deck has to reconcile all of them, by Tuesday, without the reconciliation reading as a caveat.
02 · The harvest is manual
Stitched by hand, every week, in a spreadsheet.
Someone exports each portal, pastes it into the master sheet, and chases the columns that don’t add up. It’s hours of work that has to happen again next week — and the answer is only ever as fresh as the last paste.
03 · It never ties out
The number you present is the number you hope is right.
Where did fill drop? Which partner pulled back? Which floor changed? Each system has half the signal. The reconciliation is a judgement call, and the judgement is yours to defend in the meeting.
What we do · Report harvesting
We connect to all of it.
We connect to all of it — turn-key for the big SSPs, DSPs, GAM and SpringServe, and an any-feed framework for everything else (yes, even a report that only arrives as an email attachment, and the upstream measurement and viewership feeds you want in the same picture). Every feed pulled in automatically and continuously, reconciled into one number. Reconciled means the double-counts are deduped, one source is made authoritative for each metric, and the delta between systems is shown — so the number ties out, and you can see exactly where it moved. The manual harvest disappears; the answer’s ready before the question.
Report harvesting is the automated ingestion and unification of ad-revenue reporting across every source — SSPs, DSPs, ad servers like GAM and SpringServe, and distribution partners — into one reconciled view, including upstream viewership and measurement (Conviva-class) reconciled against your ad-revenue, not just stored beside it.
Once every SSP, DSP, GAM and SpringServe feed was reconciled into one place, a multi-million-dollar revenue opportunity surfaced — one that had been hidden in the seams between systems.
— Broadcaster · FAST operator (anonymised)
Publisher · New York Post
2M+
daily impressions reconciled and protected, video + display
“Watching That has given us full control of our video advertising. Their diagnostics and troubleshooting tools have helped us find, fix and solve revenue-impacting issues much more quickly and easily than before.”
— Amanda Gomez, VP Revenue Operations, New York Post
Questions
Report harvesting, answered.
How is this different from exporting reports into a spreadsheet?
Manual exports are point-in-time, break when a partner changes format, and never connect across sources. Harvesting is continuous, any-feed, and reconciled into one view.
Does it replace my SSP, DSP or data warehouse?
No. It unifies what they report; it sits across them, not instead of them.
What can it pull in?
Turn-key connectors for popular SSPs/DSPs/GAM/SpringServe, an any-feed framework for virtually any report (even email attachments), and the reports your endpoint partners send you.
Can it bring in upstream data like viewership or measurement?
Yes — this is one of the most-wanted joins. Upstream viewership and measurement (Conviva-class) that today sit in a separate tool get harvested into the same reconciled picture as your ad-revenue data, and reconciled against it — not just stored alongside.
Is it real-time?
No. Harvesting runs on an automated, continuous cadence — not real-time alerting.
Start here
Every feed. One number.
Turn-key, any-feed, reconciled. The number’s ready before leadership asks.