01 · Time-to-detect
By the time the morning report lands, the revenue is already gone.
Five hours of exposure between the deviation and the dashboard — reconstructed after the fact, priced by the CRO in a meeting you weren’t in.
Anomaly detection in minutes, not the morning report. Every alert carries the revenue at risk — named in dollars, and routed to the owner who can fix it in about 90 seconds.
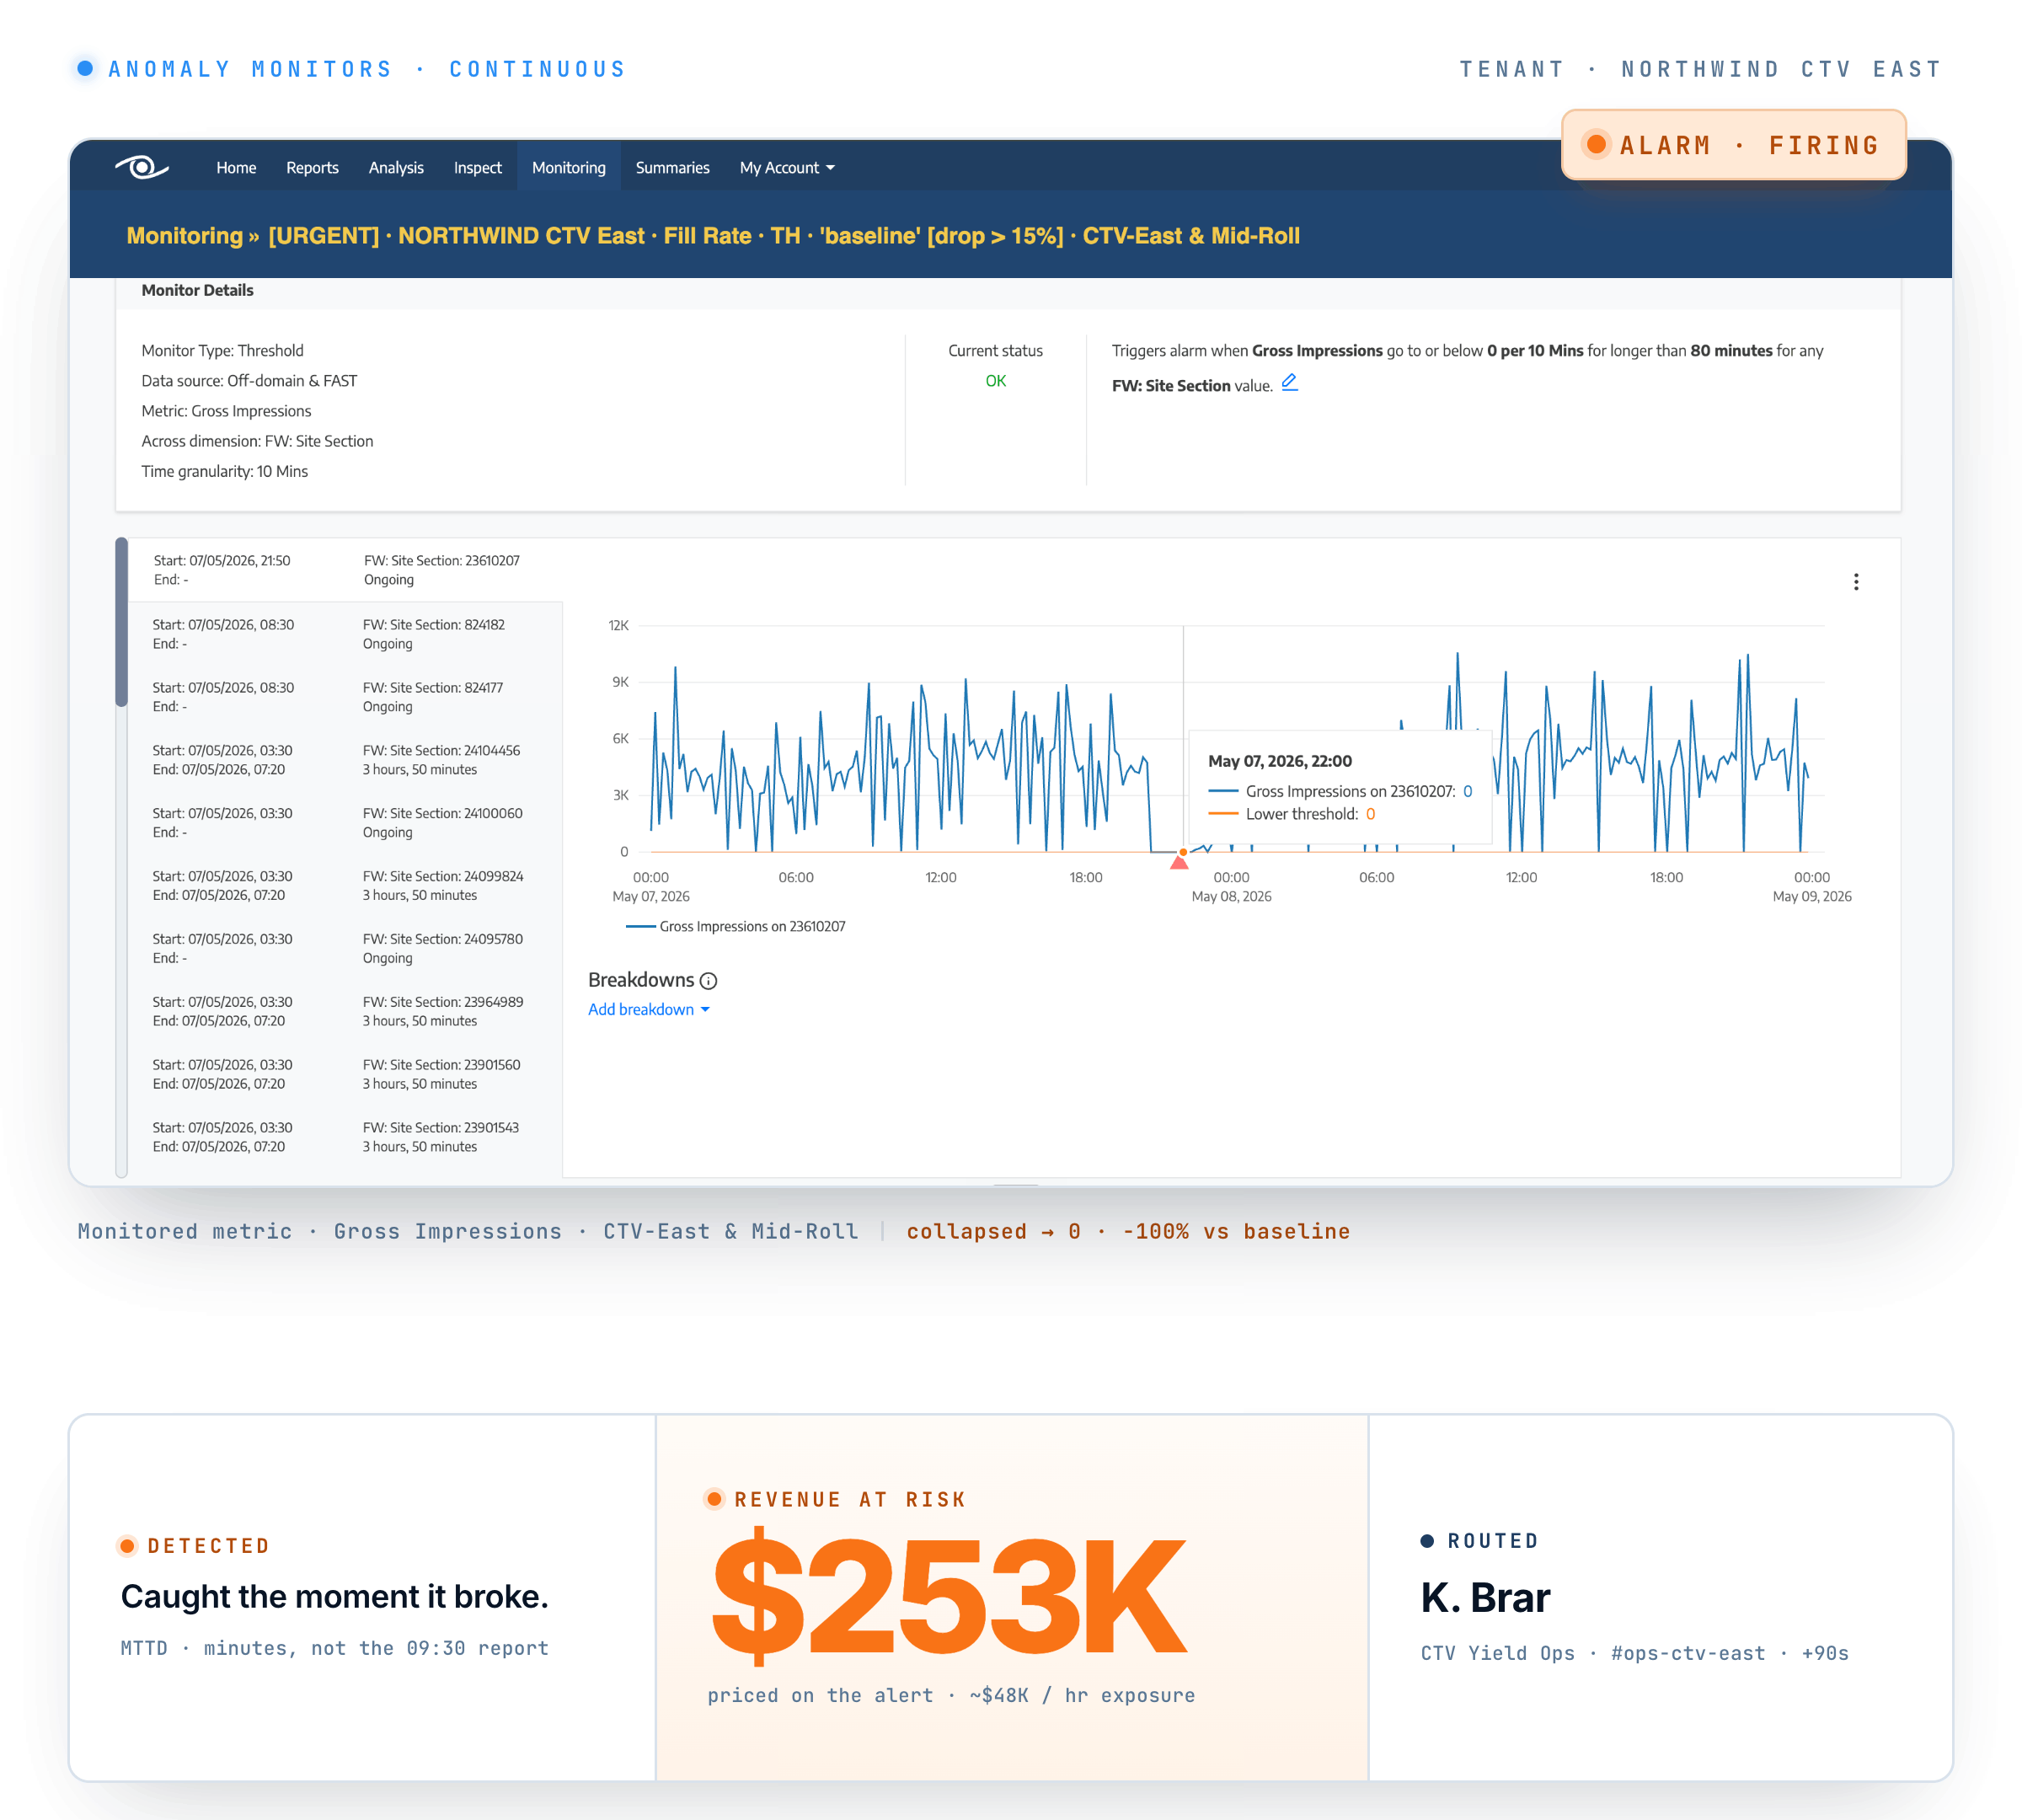
Fill collapses at 04:14; a partner starts erroring; unused inventory drifts. The pacing dashboard catches up at 09:30 — and by then it’s five hours of exposure you’ll only fully see at month-end. By the time the morning report names it, the day’s already compounded. You’re not short of dashboards. You’re short of the one thing that matters the moment a number moves: how much is this costing me, right now, and who fixes it?
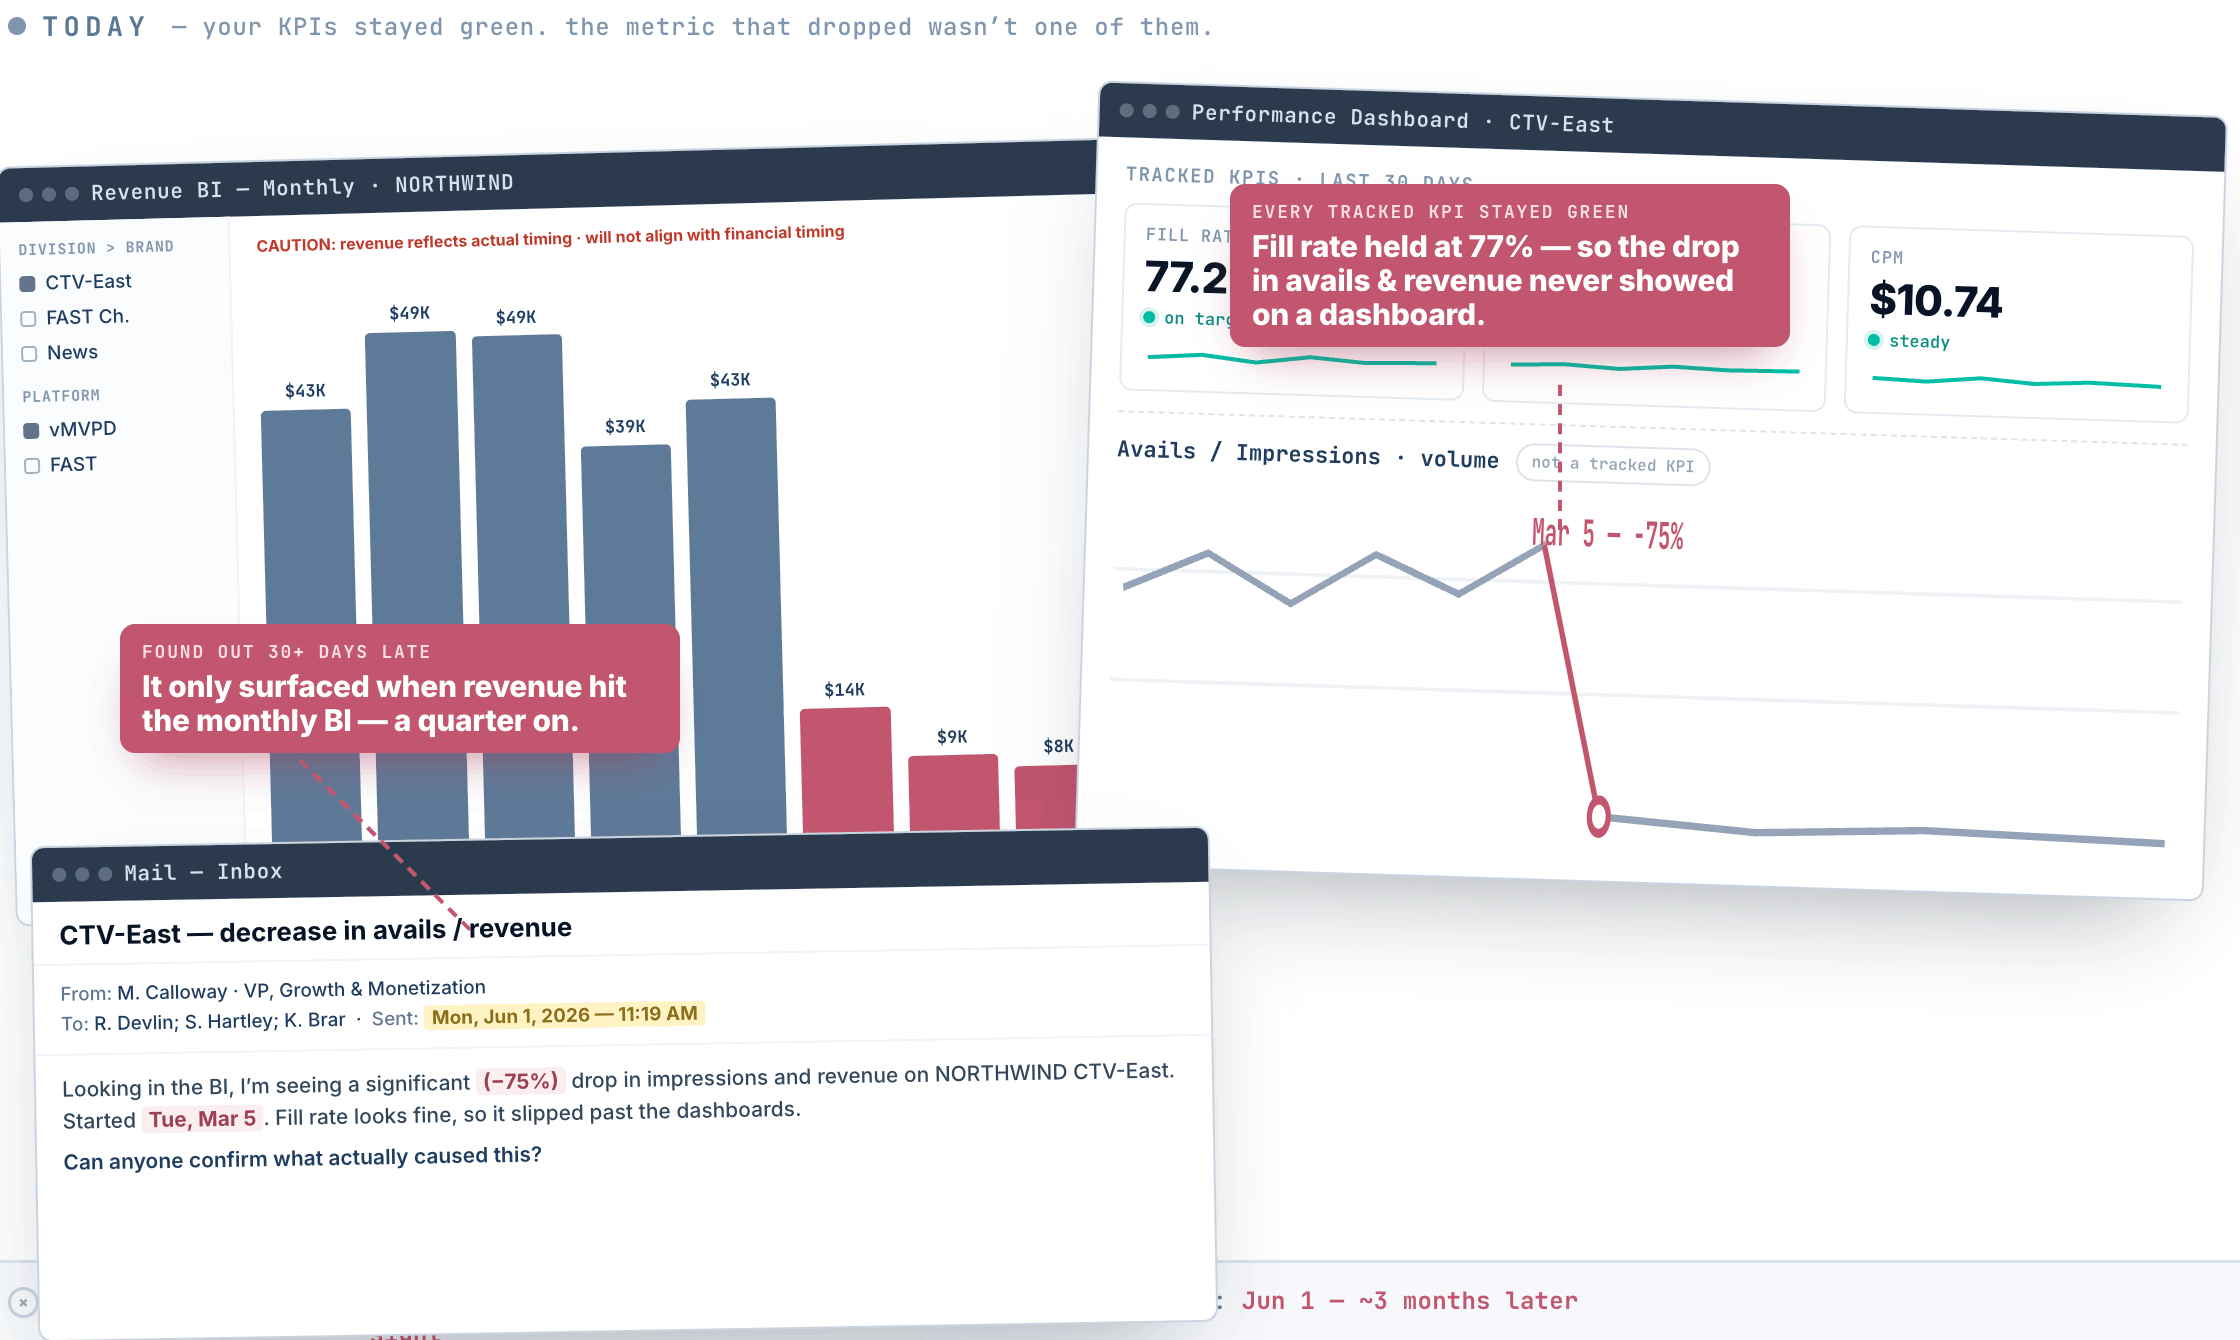
Every tracked KPI stays green. Fill rate holds at 77%, so the drop hides in a metric no dashboard watches — and only surfaces a quarter late, in the monthly revenue report.
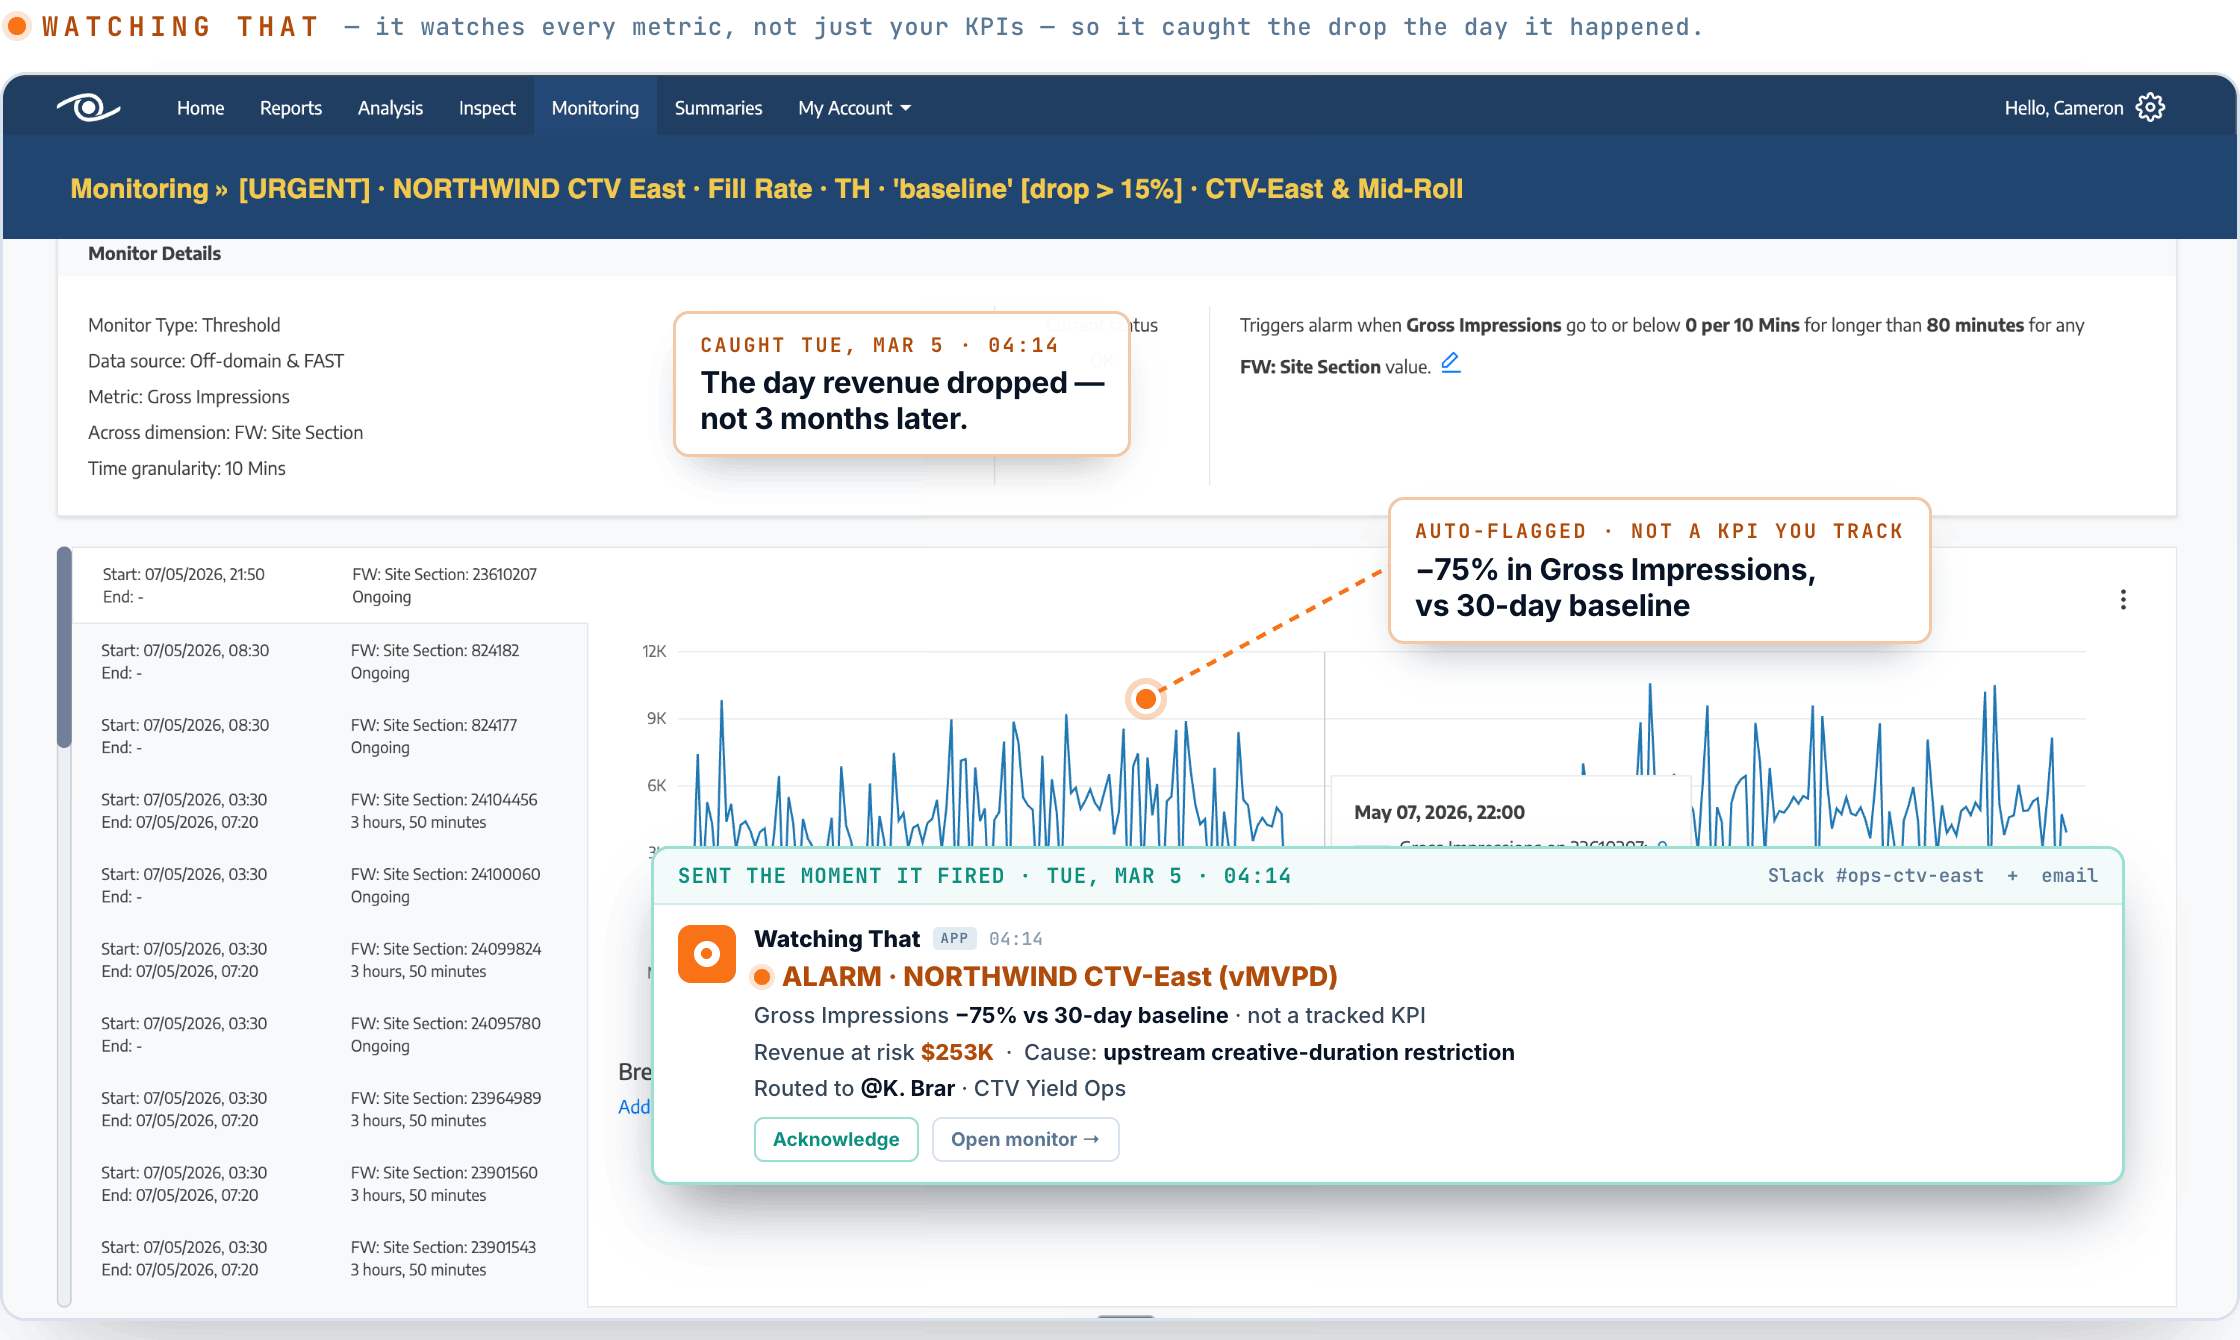
Watching That watches every metric, not just your KPIs. The same drop is auto-flagged the moment it happens, priced in dollars, and pushed to a named owner — the day it breaks, not a quarter later.
Five hours of exposure between the deviation and the dashboard — reconstructed after the fact, priced by the CRO in a meeting you weren’t in.
A deviation chip. A red arrow. Maybe a percentage. None of it answers the one question the CRO is about to ask — how much? By the time someone stitches the exposure together from three systems, the window to act has closed.
Is it the ad server? The SSP? The SSAI endpoint? The partner? The alert lives in one system; the root lives in another; the owner lives in a third. Three tabs open, the hour compounding, the exposure still live.
Watching That’s Monitoring watches your live revenue surfaces and tells you the moment one breaks — with the dollars attached.
Detect — continuous runtime checks across your ad servers, SSPs, SSAI endpoints and partner connections, each Anomaly Monitor watching one metric on one surface against its own learned baseline.
Price — the instant a Monitor fires, the deviation is priced: the alert carries the revenue at risk in dollars, not a colour on a chart.
Resolve — the fire lands with a named root and a named owner, routed in about ninety seconds through a three-stage routing tree, then reconciled end-of-day with the exposure number behind it.
The clock starts at the deviation — not at the morning report.
At national pay-TV scale, a fill collapse started mid-evening. A Monitor caught it in minutes — not at the 09:30 morning report — priced the deviation at roughly $50K an hour, and routed it to the named SSAI owner before the hour compounded. The exposure was named on the alert, from the deviation.
— Pay-TV operator (anonymised)
“Watching That has given us full control of our video advertising. Their diagnostics and troubleshooting tools have helped us find, fix and solve revenue-impacting issues much more quickly and easily than before.”
— Amanda Gomez, VP Revenue Operations, New York Post
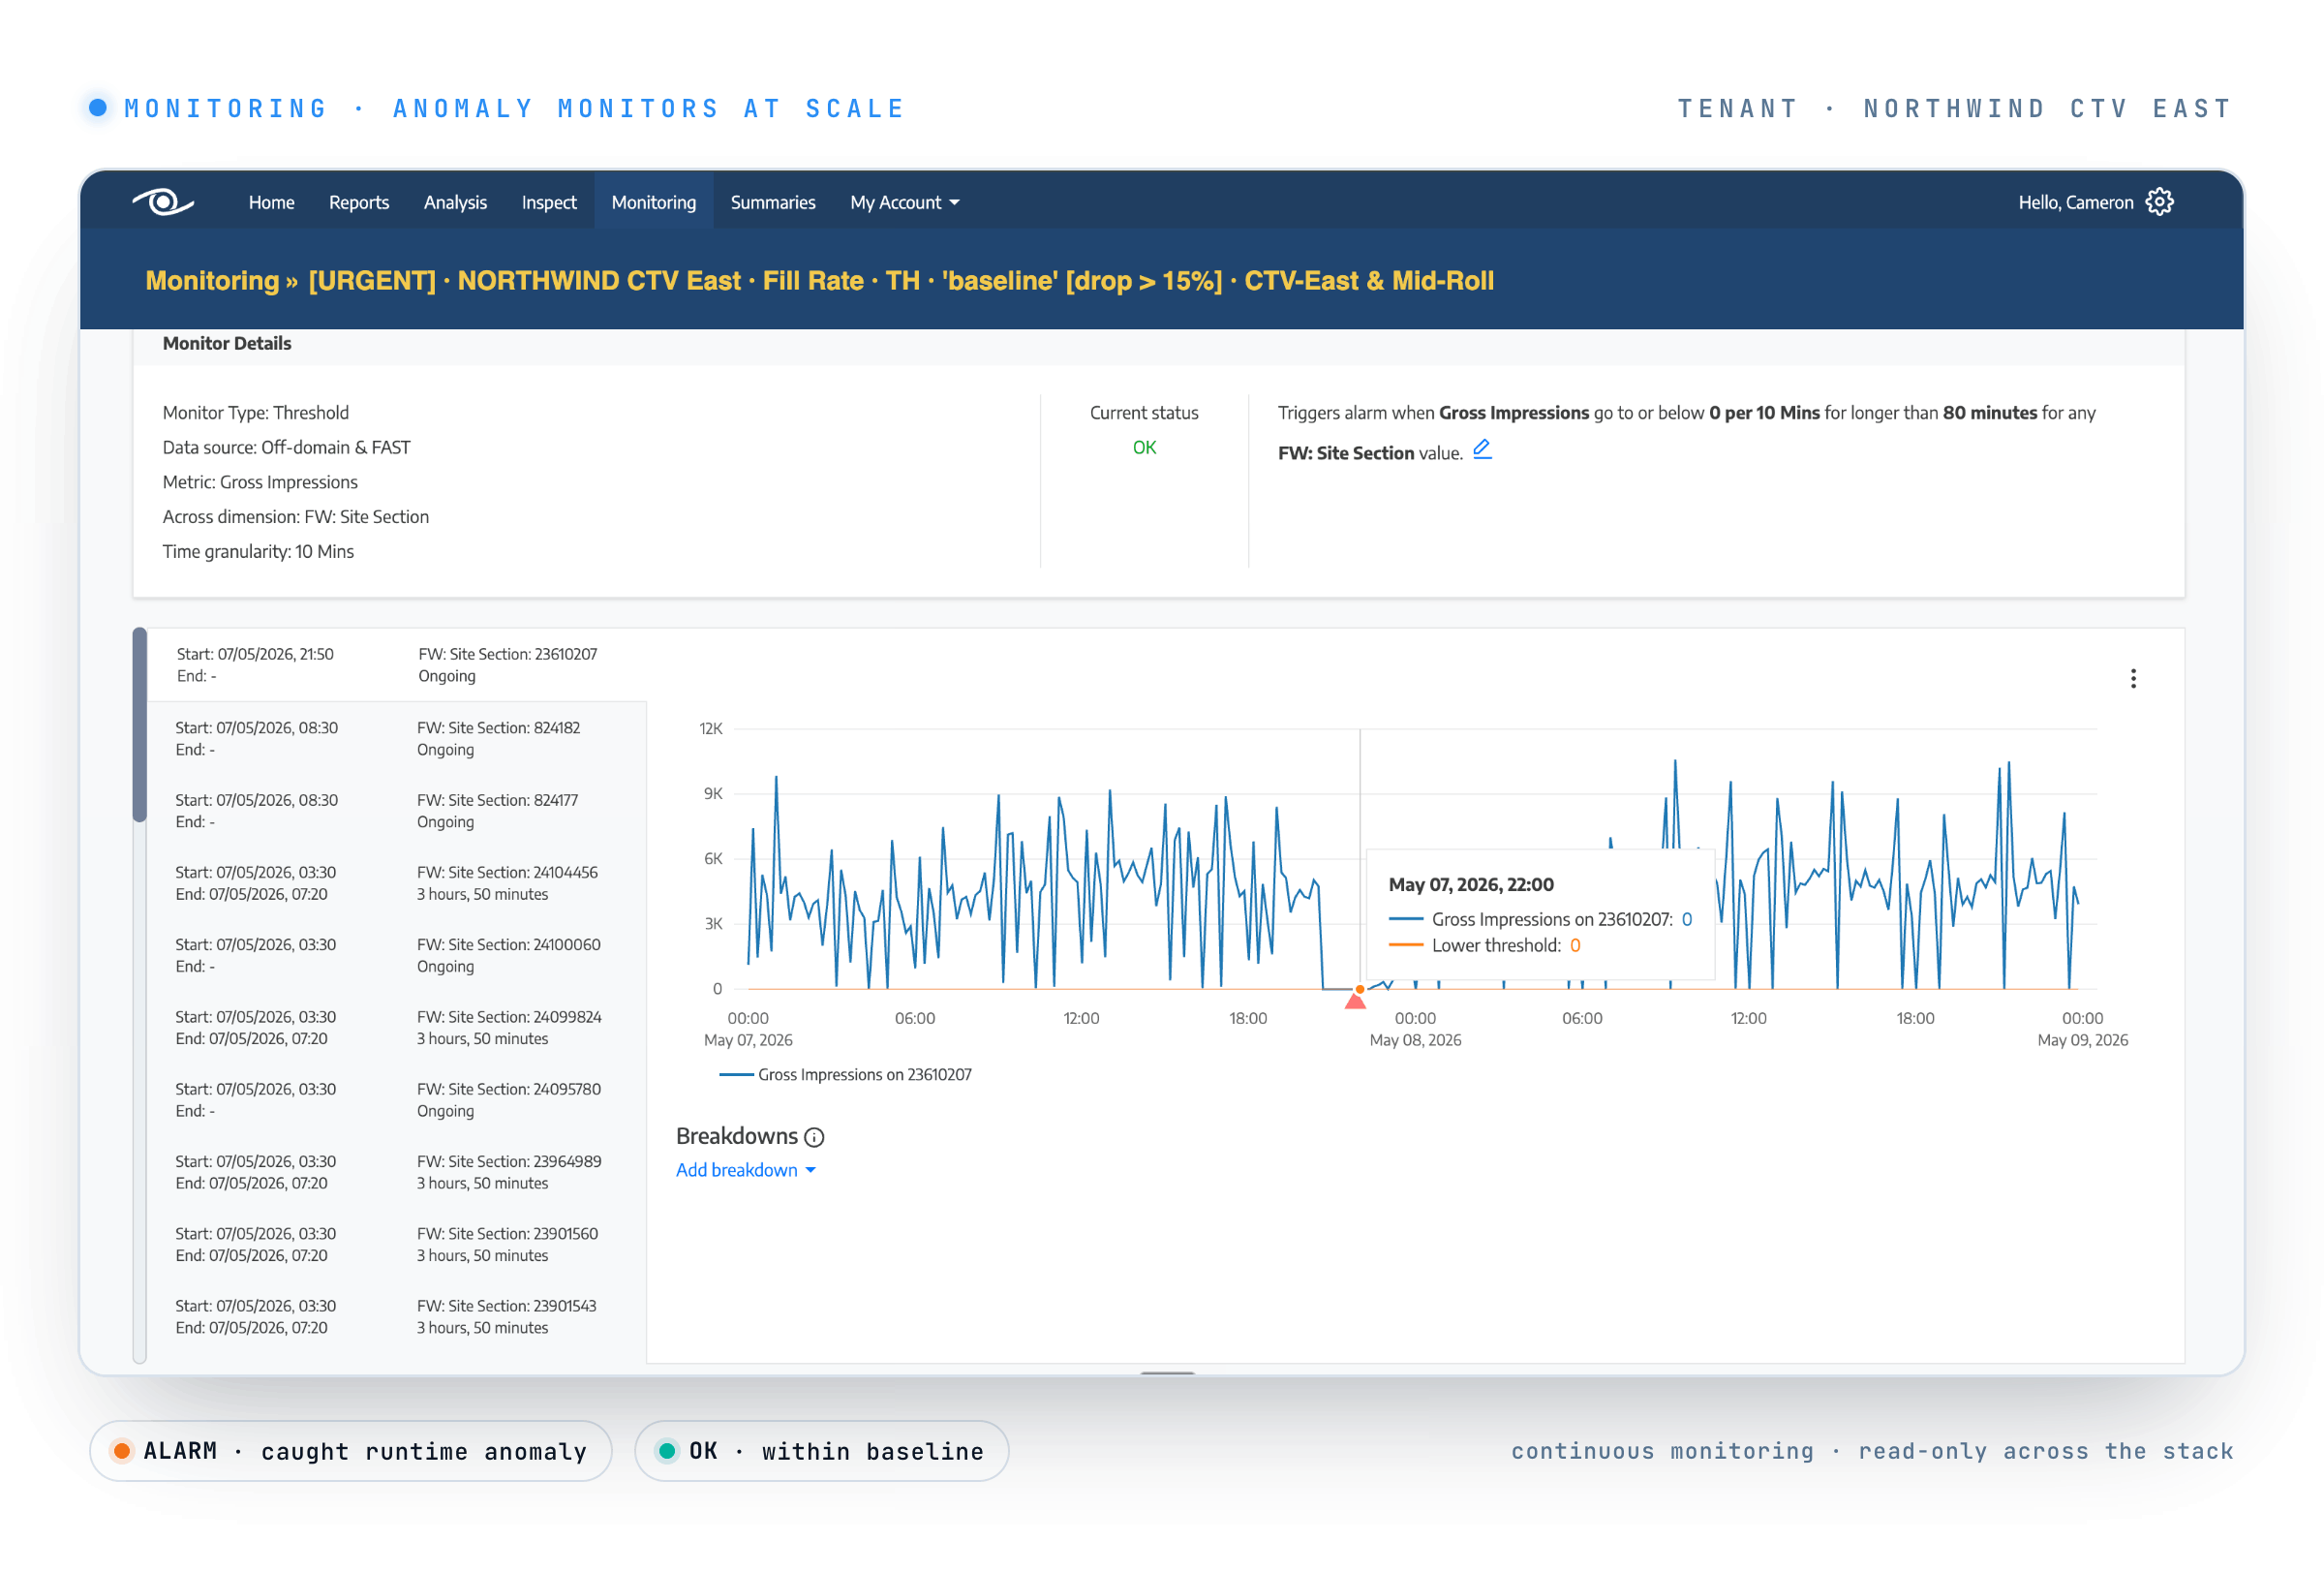
Read-only across ad servers / SSPs / SSAI / partner connections


…plus the SSAI endpoints and partner connections in between.
Live revenue anomalies on your monetisation surfaces: fill collapses, pacing deviations, partner-side error spikes, unused-inventory drift, measurement bugs. Each Anomaly Monitor watches one metric on one surface against its own learned baseline, continuously — and prices the deviation in dollars the moment it fires.
No. It runs on a continuous monitor cadence, not real-time streaming. The promise is "minutes, not the morning report": the clock starts at the deviation rather than at the next pacing report, so you catch a Tuesday drop on Tuesday — typically within minutes — while you can still act on it.
Every alert carries the revenue at risk as a dollar figure, not a colour on a chart. The deviation is priced on the way out, so you triage by exposure — and the figure is reconciled end-of-day in Report.
No. It's a read-only monitoring layer that watches across your ad servers, SSPs, SSAI endpoints and partner connections; it sits across them, it doesn't touch or replace them.
A pacing dashboard tells you something moved, after the fact, with no dollar figure and no owner. Watching That detects the deviation as it happens on the monitor cadence, prices it in dollars, names the root and the owner, and routes it in about ninety seconds — before the hour compounds.
Anomaly detection in minutes, not the morning report — every deviation priced in dollars and routed to a named owner before the day compounds.